
Bitcoin Price Prediction – May 24
The Bitcoin price is currently trading towards the 9-day moving average after the first digital asset took a dip from the resistance level of $59,592.
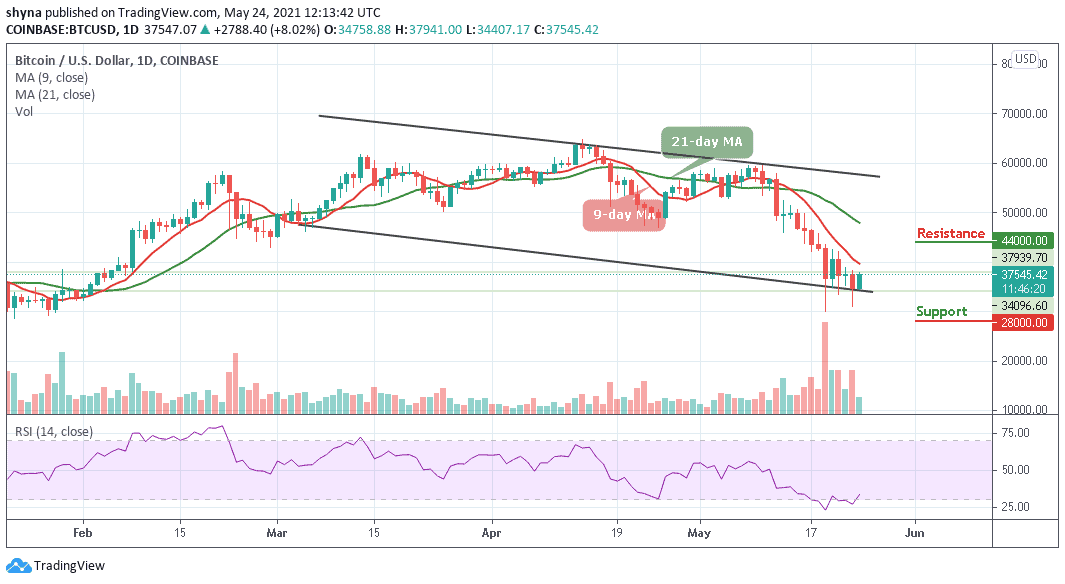
BTC/USD Long-term Trend: Bearish (Daily Chart)
Key levels:
Resistance Levels: $44,000, $46,000, $48,000
Support Levels: $28,000, $26,000, $24,000
BTC/USD bulls may be back in action today after staying under solid pressure over the previous days. However, the Bitcoin price is up 8.02% as of writing this and it is currently hovering above the $35,000 level. The cryptocurrency had been in a downtrend for the previous week as it dropped to reach its monthly low at $30,000 support.
Bitcoin Price Prediction: Where is BTC Price Going Next?
At the time of writing, BTC/USD is trading at $37,545 with a gain of 8.02% on the day. The trading is likely to cross above the 9-day moving average as the technical indicator Relative Strength Index (14) moves out of the oversold region. It is important that the bulls climb above the 9-day MA as this would allow them to focus on higher levels towards $45,000.
Meanwhile, any declines below the lower boundary of the channel could easily re-open the way to the south. The breakdown towards $32,000 is not out of the picture because the losses in the last few days show that BTC/USD may not be technically ready for the breakout above $50,000. Looking at the daily chart, the Bitcoin price is making an attempt to regain ground by moving the market price to the next level.
Moreover, any bullish movement above the 9-day MA may push the price to the resistance level of $44,000, $46,000, and $48,000 while the supports are located around $28,000, $26,000, and $24,000 respectively.
BTC/USD Medium – Term Trend: Bearish (4H Chart)
The 4-hour chart reveals that the Bitcoin price crosses above the 9-day and 21-day moving averages and if the price continues to rise further and move above the upper boundary of the channel, it could reach the nearest resistance levels at $42,000, $44,000, and $46,000 respectively.
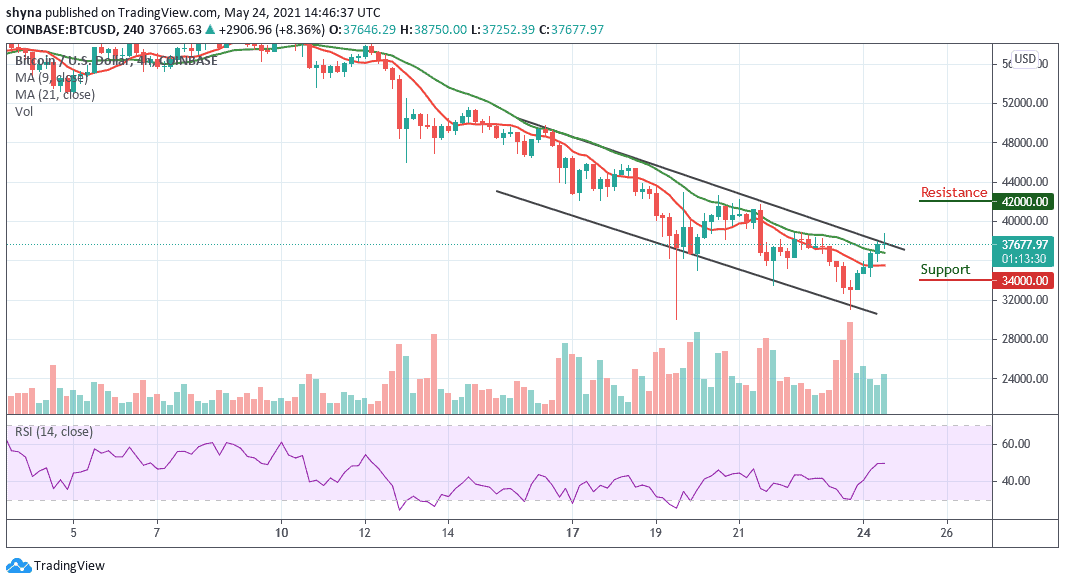
Moreover, if the bears push the coin below the 9-day and 21-day moving averages, the price of Bitcoin may likely reach the closest supports at $34,000, $32,000, and $30,000. Presently, the technical indicator Relative Strength Index (14) is seen moving around the 50-level, crossing above it may confirm the bullish trend for the market.


