

The Bitcoin rollercoaster continues after the price dropped by a precipitous 14% from today’s high of $33,250 to reach as low as $28,600. After hitting this level, the cryptocurrency quickly rebounded back above $32,000 liquidating a huge amount of long then short positions.
Yesterday, it seemed like the critical support of $31.7K was holding, however, earlier today Bitcoin broke the ascending trend line (started forming on May 19), losing the $30k support, but, as of now, the price bounced back above.
So far, the past 7 days have been a nightmare for Bitcoin, as the primary cryptocurrency touched $41.3K just last Tuesday. Keeping in mind today’s current low of $28.6K, the price dropped over 30%, before slightly recovering. $28,600 is a 5-month low for Bitcoin. The last time it was trading below $30K was during January 2021.
Moving forward, Bitcoin is still in danger, however, two things might light a bit of positiveness on the market:
– The fact that Bitcoin price quickly rebounded over $4k after plunging below $30k shows that there is very strong demand, especially below $30k.
– The consolidation zone between $30k and $42k, which lasted since May 19, is still intact.
Despite the above, the situation is very fragile, as volatility is expected to continue for the next few days at least.
In addition, the bounce allowed Bitcoin to remain inside the descending price channel as shown on the short-term chart below and buyers defended $31,185 support, and the candle did not close beneath it.
BTC Price Support and Resistance Levels to Watch
Key Support Levels: $31,700, $31K, $30,000, $28,600, $27,740.
Key Resistance Levels: $32,465, $33,520, $34,760, $36,440, $37,500.
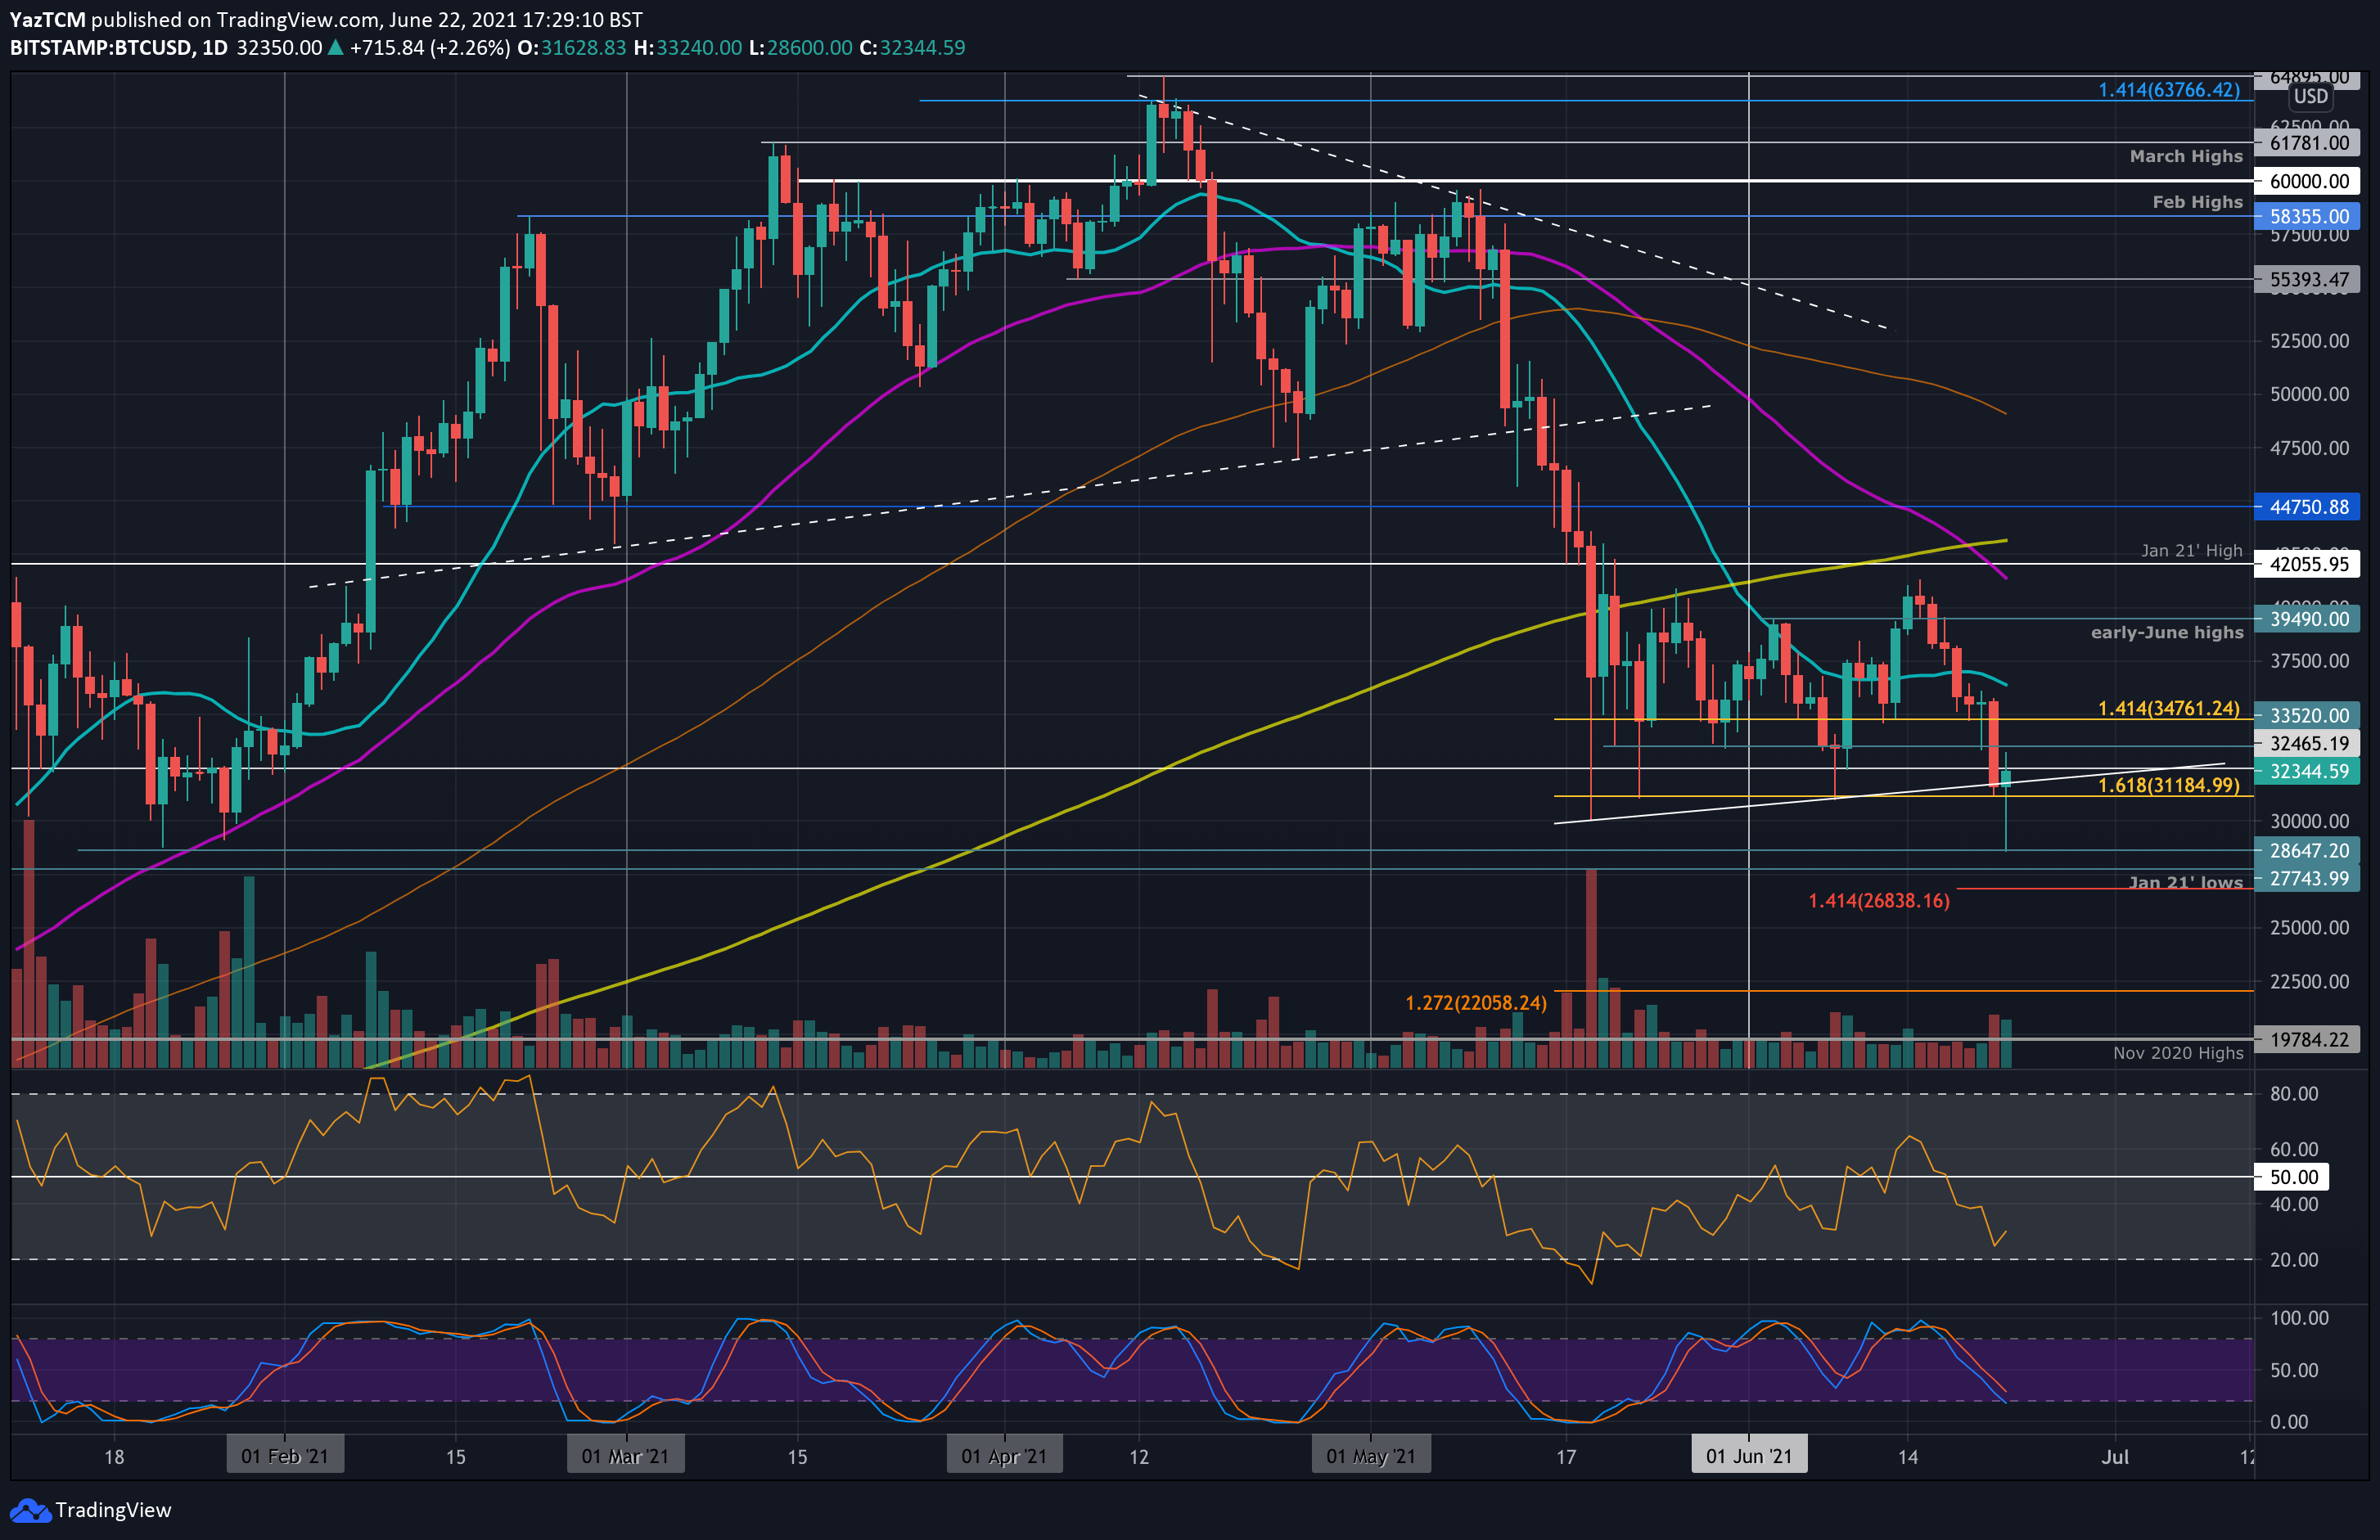
Looking ahead, the first support now lies at $31,700 (yesterday’s low and the ascending trend-line). This is followed by ~$31k – $31,185 (downside 1.618 Fib Extension), $30,000, and $28,600 (today’s low). Additional support lies at $27,740 (Jan 2021 lows), $26,840 (downside 1.414 Fib Extension), and $25,000.
On the other side, the first resistance lies at $32,465. This is followed by $33,520, $34,760, $36,440 (20-day MA), $37,500, and $39,490 (early-June highs).
The daily RSI is well within the bearish territory and is still not yet oversold. It is starting to push higher, which indicates that the bearish momentum might be easing up a little. Aside from that, a bullish divergence signal has also appeared on the LTF charts, such as the 4-hour’s.
Bitstamp BTC/USD Daily Chart
Bitstamp BTC/USD 4-Hour Chart


