

Bitcoin Price Prediction – July 6
Today, the Bitcoin price tried to break above the $35,000 mark but with no success as the coin drops below the moving averages.
BTC/USD Long-term Trend: Ranging (Daily Chart)
Key levels:
Resistance Levels: $38,000, $40,000, $42,000
Support Levels: $30,000, $28,000, $26,000
At the time of writing, BTC/USD is currently losing its balance below the $35,000 level as traders remained jittery about its recent retreat to trade at $33,925. The Bitcoin price drops toward the opening price of $33,697, trading with 0.67% from its opening rate. However, during the European session, the green candle rises to cross above the 9-day and 21-day moving averages before sliding back below $35,000.
Bitcoin Price Prediction: Is there any Expectation for the Bitcoin Price?
The Bitcoin price is currently moving sideways but as long as the technical picture remains intact, the Bitcoin bulls could have a fighting chance at reclaiming the support at $33,000. Therefore, traders should note that BTC/USD is holding below the 9-day and 21-day moving averages. This means that the technical health of Bitcoin is currently weak as bulls may lose the market with a serious downward trend.
However, on the downside, any other drop below the opening price of $33,697 could open with losses and may increase fast towards the nearest support at $3200. Moreover, a lower price for Bitcoin is the only way to create support and bring back buyers into the market. More so, the fight to remain above $35,000 will continue to take precedence.
On the upside, a recovery above the $36,000 level could pave the way for another run-up to $38,000, $40,000, and $42,000 respectively. On the flip side, support is expected at $30,000, $28,000, and $26,000. Therefore, it is apparent that bears have more strength with the Relative Strength index (14) to print a bearish session.
BTC/USD Medium – Term Trend: Ranging (4H Chart)
According to the 4-hour chart, the Bitcoin price is currently trading around $34,002 and below the 21-day moving average after falling from $34,521 where the coin touches today. However, from a technical point of view, the trend is in the hands of the sellers.
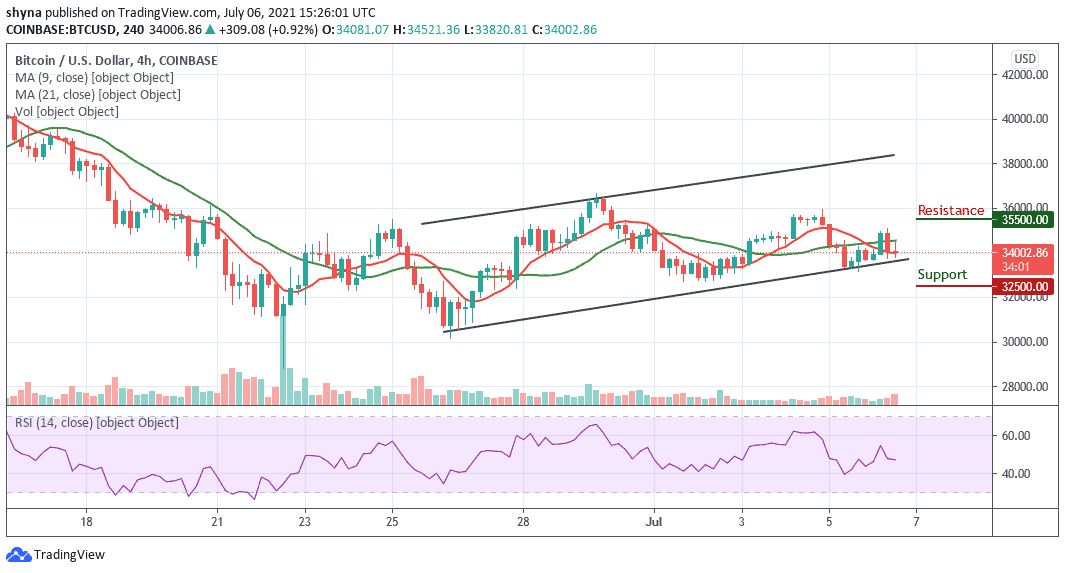
Nevertheless, the Relative Strength Index (14) is moving below the 50-level but as long as the downward trend continues, keeping Bitcoin above $35,000 may not come easy. In this case, it is best the traders look at possible support levels located at $32,500 and below while the resistance levels lie at $35,500 and above.
Looking to buy or trade Bitcoin (BTC) now? Invest at eToro!
75% of retail investor accounts lose money when trading CFDs with this provider


