

The lack of factual information utilized in reports by the publication is alarming and misleading.
This is part two in an ongoing series taking a look at the electricity consumption and environmental impact of Bitcoin Mining — Part 1 is available here.
The Digiconomist and their Bitcoin Electricity Consumption Index is one of the oldest and most cited sources in the Bitcoin environmental and energy debate. This single data point makes up the basis for a significant amount, if not the vast majority, of media reports on Bitcoin and its environmental impact.
In part 1, we took Digiconomist’s data and contextualized the data globally and historically. All this information, taken at face value, shows that Bitcoin’s impact on the global climate is essentially about 0.1%. An immaterial number in any context.
In this follow-up we question Digiconomist’s model.
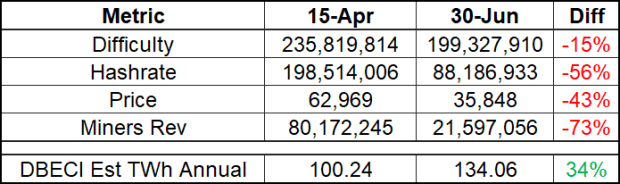
Over the past few weeks and months Bitcoin’s network hash rate has fallen approximately 56% from a high of an estimated 198 EH/s on April 15, 2021 to the current estimate of 88 EH/s on June 30, 2021.
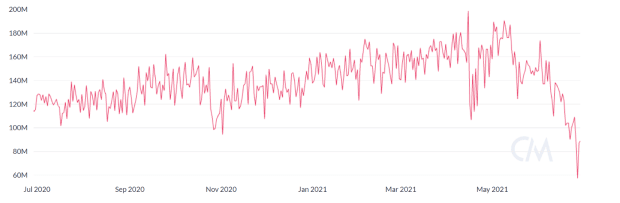
This is largely driven by recent developments in China which have banned almost all Bitcoin mining activity in the country in stages. All major metrics are down in this same time period.
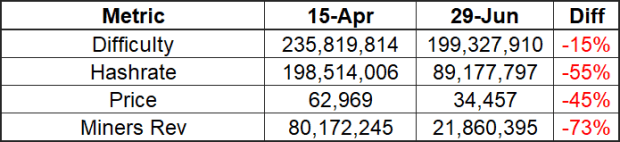
Given the measurable and meaningful reduction in all these key data points, hash rate, difficulty and price/mining profit we would expect that Bitcoin’s estimated electricity consumption and estimated emissions would also fall as a result.
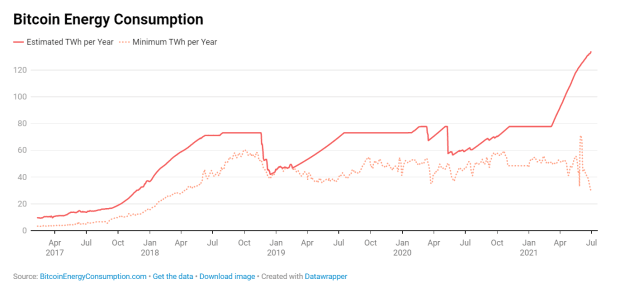
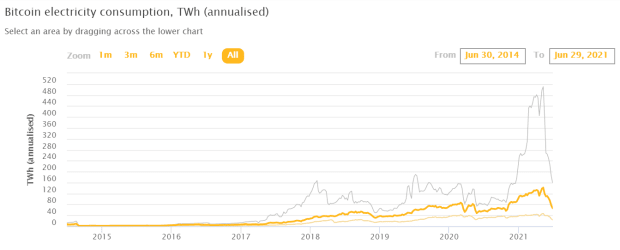
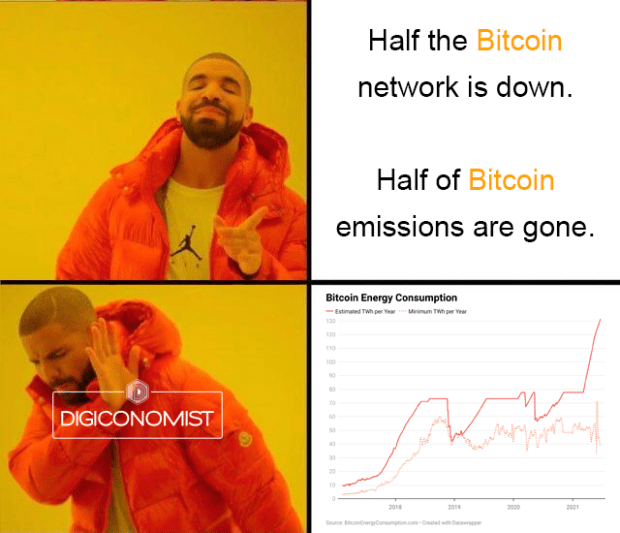
Digiconomist is actually showing the complete opposite of that. Consistently increasing power consumption and emissions figures.
Looking at the Digiconomist’s Methodology, this model is based entirely on mining profitability measured per hash rate and the given cost of bitcoin per day.
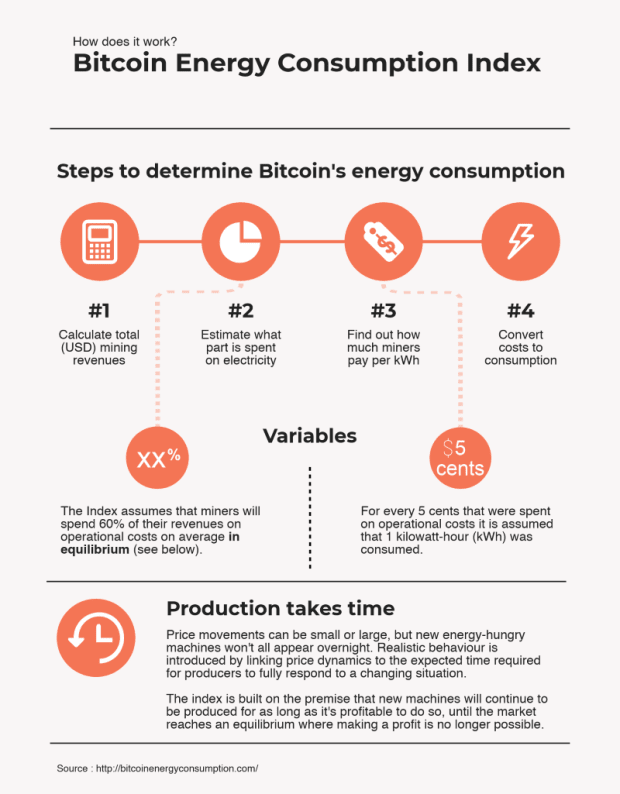
According to this cited methodology, we would expect that over the same time period, all things being equal, Digiconomist would show a commensurate 73% approximate reduction in estimated electricity consumption and emissions, to match the 73% reduction in Bitcoin mining revenue, or the 55% reduction in network hash rate. Instead we have seen an increase in electricity consumption and emissions by 34%.
Something is clearly wrong here. The Cambridge Bitcoin Electricity Consumption Index has functioned perfectly during this same time period and has actively reflected the real changes in the Bitcoin network in real time.
So what is going on with Digiconomist?
We downloaded the actual dataset from Digiconomist to take a closer look. The results are really clear when viewed on a day-by-day basis.
The model is not being driven by real world profitability and metrics as stated in the methodology. There are several month periods that show a consistent percentage growth on a day-by-day basis at either 0.300% or 0.000%. These changes are consistent for months despite significant changes in network hash rate, difficulty, price and mining profitability.
Furthermore since March 7th, despite the phased shutdown of half the Bitcoin network occurring during the same time, the daily estimate has nearly doubled, increasing by a total of ~85%, on average ~0.45% per day, in an almost perfectly linear fashion.
The only correlation that can be observed in the Digiconomist model is related to difficulty. All changes in growth rate cycles occur with difficulty changes. However there is no correlation with changes in difficulty and the actual estimated electricity consumption, growth rates and associated emissions.
The difficulty adjustment on March 6th showed a decrease of approximately 1.3%. This triggered a move from a fixed daily growth rate of 0.000% to an average daily growth rate of 0.68%, or 8% for that difficulty cycle.
A measurable reduction in Bitcoin computation, as measured by hashrate, block processing times and difficulty resulted in an estimated increase in electricity consumption and associated emissions in the Digiconomist model. This is an unexplainable and illogical trend that we have seen played out repeatedly over the last several months and difficulty adjustments.
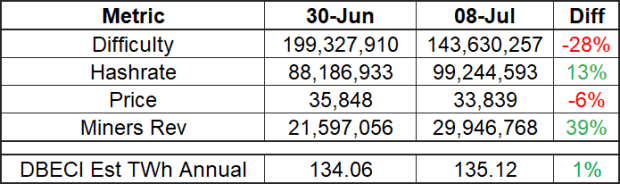
On July 3 2021, Bitcoin experienced it’s largest single difficulty drop in history, around -28%. This is only possible due to a huge amount of Bitcoin computation coming off the network for a sustained amount of time. This is the network responding to recent developments in China. As such we would expect a commensurate massive drop in electricity consumption and emissions.
Instead the Digiconomist model has not adjusted at all and is now showing a daily change of 0.000%, flatlining at its highest measurement ever of 135.12 TWh annually. This after the market has seen it’s largest reduction in hashrate ever.
The only way mathematically for this to occur is for miners to turn off hundreds of thousands of new-gen highly efficient and highly profitable miners and replace them with millions of old-gen less efficient and less profitable miners. ILLOGICAL.
To be clear there is NO CORRELATION between daily electricity consumption/emissions growth rate and hashrate, difficulty, Bitcoin price and/or miner profitability.
The Digiconomist Bitcoin Electricity Consumption Index is not being driven by real world metrics and profitability as stated in the methodology.
This is NOT science. That much is settled.
This is a guest post by Ben Gagnon. Opinions expressed are entirely their own and do not necessarily reflect those of BTC Inc. or Bitcoin Magazine.


