

Bitcoin Price Prediction – September 18
The Bitcoin price prediction is seen facing the upside as the coin rises to trade above $48,000.
BTC/USD Long-term Trend: Ranging (Daily Chart)
Key levels:
Resistance Levels: $52,000, $54,000, $56,000
Support Levels: $44,000, $42,000, $40,000
BTC/USD shoots to the north as the recent move marks a tremendously upward movement, but it is important to note that the Bitcoin price has not exceeded any major technical level. Looking at the daily chart, BTC/USD has been trying to start the upward move since the European session but it is struggling to gain momentum as the uptrend of the entire market comes to a standstill.
Bitcoin Price Prediction: Bitcoin Not Yet Ready for The Upside
At the time of writing, the Bitcoin price is trading up 1.46% at its current price of $48,049 level. Moreover, as the resistance mounts, the positive movement towards $50,000 may likely come into focus and the next few days could reveal where Bitcoin (BTC) and other altcoins will trend. However, if the king coin decides to dig dip; it’s likely to hit the critical supports at $44,000, $42,000, and $40,000 respectively.
Furthermore, should in the case of bulls keeping the price above the 9-day MA; moving up further to cross the 21-day moving average could take the price towards the upper boundary of the channel which may likely touch the resistance levels of $52,000, $54,000, and $56,000. The technical indicator Relative Strength Index (14) is likely to face the upside to suggest more bullish signals into the market.
BTC/USD Medium – Term Trend: Ranging (4H Chart)
Looking at the 4-hour chart, BTC/USD is trading at $48,060 as all eyes are glued to the $49,000 resistance level. At the time of writing, the Bitcoin price is crossing below the 9-day and 21-day moving averages as the existing trend is still ranging. However, the sellers may begin to control the market but sideways movement may continue to play out.
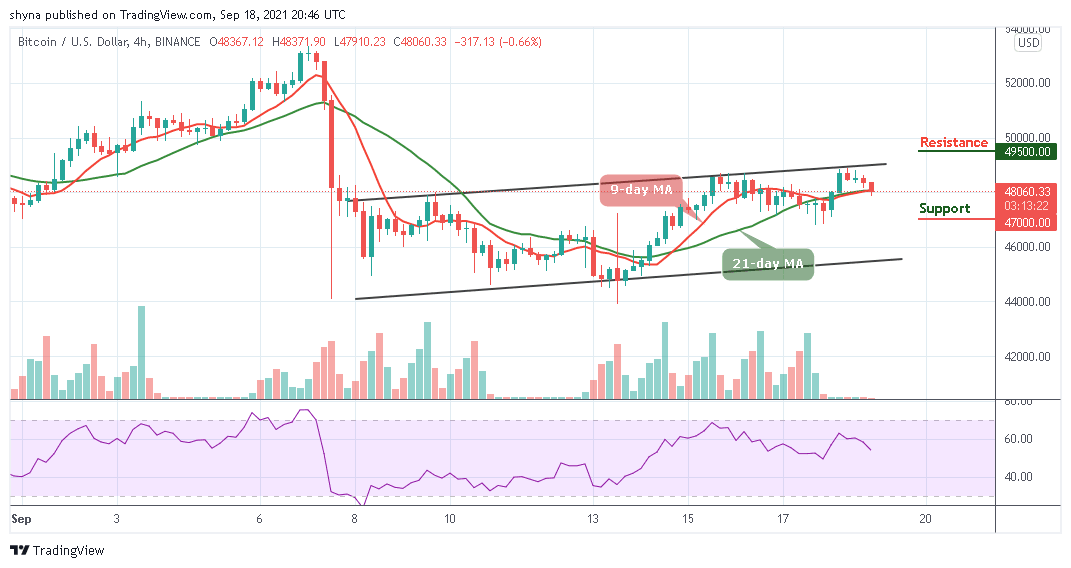
At the time of writing, the red-line of 9-day MA is still below the green-line of 21-day MA, and the coin may likely retest the support level of $47,000 and below if the price crosses this barrier. To confirm this, the technical indicator Relative Strength Index (14) is seen following the downward movement below 55-level. Therefore, BTC/USD may likely touch the resistance level of $49,500 and above if the price moves above the upper boundary of the channel.
Looking to buy or trade Bitcoin (BTC) now? Invest at eToro!
67% of retail investor accounts lose money when trading CFDs with this provider
Read more:


