

Bitcoin Price Prediction – December 11
The Bitcoin price prediction shows that BTC remains above $48,000 level as the bulls are holding tight to the market.
BTC/USD Long-term Trend: Bearish (Daily Chart)
Key levels:
Resistance Levels: $55,000, $57,000, $59,000
Support Levels: $41,000, $39,000, $37,000
BTC/USD shows some signs of immense strength as buyers propel it up towards $50,000 today. However, the 9-day moving average is currently below the 21-day moving average, and bulls are getting ready to break above this barrier. Meanwhile, the buyers are dominating the market currently, and there is a strong likelihood that further upside may come about in the next few days.
Bitcoin Price Prediction: Bitcoin (BTC) Likely to Dig Dip
At the time of writing, the Bitcoin price is hovering at 3.34% at its current price of $48,744. Moreover, as the resistance mounts, the movement towards $50,000 may likely come into focus and the next few days may likely reveal where Bitcoin (BTC) and other altcoins may trend in the coming week.
Moreover, if bulls can cause the price to cross above the 9-day moving average, moving up further could push the price above the 21-day moving average to touch the resistance levels of $55,000, $57,000, and $59,000. Fortunately, the technical indicator RSI (14) is likely to cross above 40-level, suggesting additional bullish signals into the market.
BTC/USD Medium – Term Trend: Ranging (4H Chart)
On the 4 hour chart, BTC/USD is trading at $48,599 as all eyes are glued on the $50,000 resistance level. Looking at the chart currently, the coin is seen trading around the 9-day and 21-day moving averages while the existing daily trend is ranging. Therefore, the buyers could begin to push the king coin slowly but rapid price actions may need to play out.
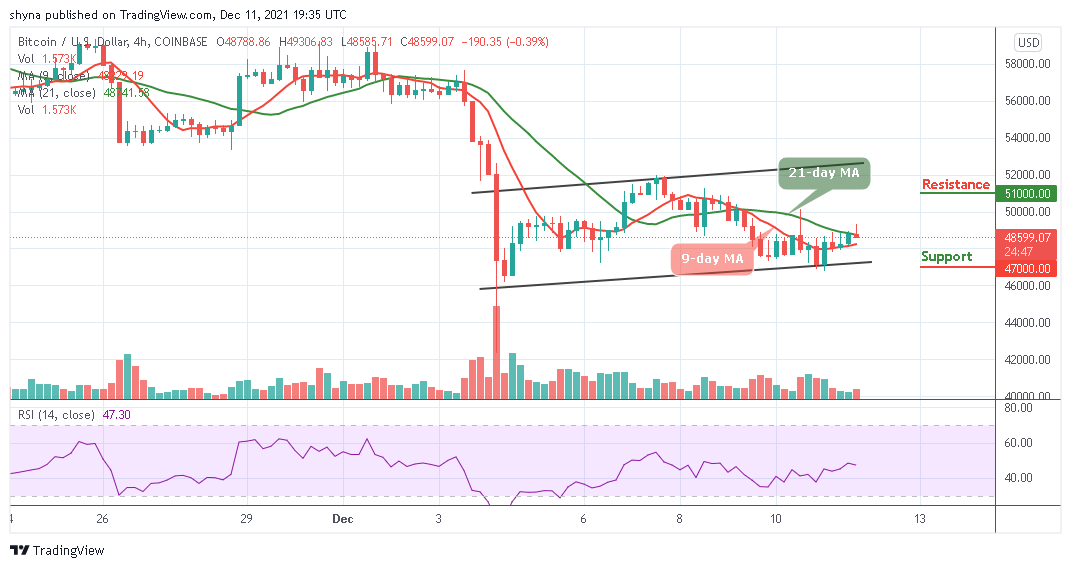
At the moment, the bullish trend line may need to be broken, that is why the Bitcoin price is yet to change the market trend and it is likely for the coin to retest the support of $47,000 and below. Meanwhile, if the technical indicator Relative Strength Index (14) continues to move sideways, BTC/USD may likely hit the resistance level of $51,000 and above.
Looking to buy or trade Bitcoin (BTC) now? Invest at eToro!
68% of retail investor accounts lose money when trading CFDs with this provider
Read more:


