

Bitcoin Analysis
Wednesday’s daily session saw BTC’s price rally and regain the $41k level while concluding its daily candle +$1,068.
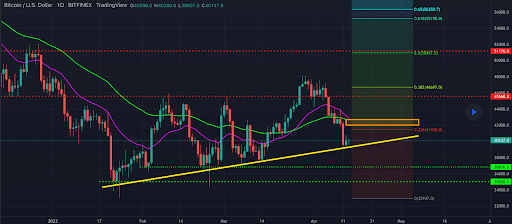
The BTC/USD 1D chart below from eralpbuyukaslan shows bullish traders trying to hold the $40k level and again reclaim some territory above the 0.236 fib level [$41,438.]. If they’re successful the next targets to the upside are 0.382 [$46,697.] and 0.5 [$50,947.5].
From the position of a bearish BTC market participant, they’re looking to again send BTC’s price back down to retest the $36.8k level followed by a potential trip back down to 0 [$32,937.] if they succeed at the $36,8k level.
Bitcoin’s Moving Averages: 5-Day [$41,119.1], 20-Day [$43,669.47], 50-Day [$41,958.42], 100-Day [$44,038.29], 200-Day [$46,590.61], Year to Date [$41,576.29].
BTC’s 24 hour price range is $39,445-$41,443 and its 7 day price range is $39,445-$43,970. Bitcoin’s 52 week price range is $29,341-$69,044.
The price of bitcoin on this date last year was $63,576.
The average price of BTC for the last 30 days is $43,201.
Bitcoin’s price [+2.66%] closed its daily candle worth $41,155 and in green digits for a second straight candle close.
Ethereum Analysis
Ether’s price traded in green figures for its daily session by nearly 3% on Wednesday and finished the day +$89.28.
The second chart we’re analyzing this Thursday is the ETH/USD 1D chart below by eralpbuyukaslan. Ether’s price is trading between the 0.236 fibonacci level [$2,796.13] and 0.382 [$3,191.87], at the time of writing.
The 0.382 fib level is where bullish traders hope they can again swing short-term momentum in their favor. After, the next target to the upside is 0.5 [$3,511.71] and thirdly 0.618 [$3,831.56].
Bearish traders are trying to push ETH’s price below the 0.236 fib level and back down to the neckline of its current pattern.

Ether’s Moving Averages: 5-Day [$3,099.57], 20-Day [$3,176.89], 50-Day [$2,954.10], 100-Day [$3,281.42], 200-Day [$3,318.62], Year to Date [$2,975.03].
ETH’s 24 hour price range is $2,983-$3,111 and its 7 day price range is $2,967-$3,300. Ether’s 52 week price range is $1,719-$4,878.
The price of ETH on this date in 2021 was $2,304.
The average price of ETH for the last 30 days is $3,109.
Ether’s price [+2.95%] closed its daily candle on Wednesday worth $3,116.93 and in green figures for back to back days.
FTX [FTT] Analysis
FTX token’s price rose more than 2% on Wednesday and concluded its daily session +$1.09.
The third chart we’re analyzing today is the FTT/USD 1W chart below from olliecoughland. The chart shows FTT’s price trading between the 0.618 fib level [$30.696] and 1 [$47.636] on the weekly time frame.
The next targets for bullish FTT traders are the 1 fib level, 1.618 [$75.041] and 2.618 [$119.387].
Bearish traders are conversely looking to break the 0.618 fib and push FTT’s price below 0.5 [$25.46] for the first time this year. The third target to the downside for bearish traders is 0.236 [$13.756].
![FTX [FTT] Analysis](https://cryptonomist.ch/wp-content/uploads/2022/04/img-3-9.png)
FTX’s price is -21.38% against The U.S. Dollar for the last 12 months, +24.44% against BTC and -41.85% against ETH over the same duration, at the time of writing.
FTT’s 24 hour price range is $41.30-$43.04 and its 7 day price range is $41.30-$46.49. FTT’s 52 week price range is $31.34-$84.18.
FTX’s price on this date last year was $55.49.
The average price of FTT over the last 30 days is $46.34.
FTX token’s price [+2.61%] closed its daily candle worth $42.86 on Wednesday and in green figures for a second straight day.
The post Bitcoin, Ethereum, FTX [FTT] Price Analyses appeared first on The Cryptonomist.


