Bitcoin (BTC) Price Prediction – May 5, 2021
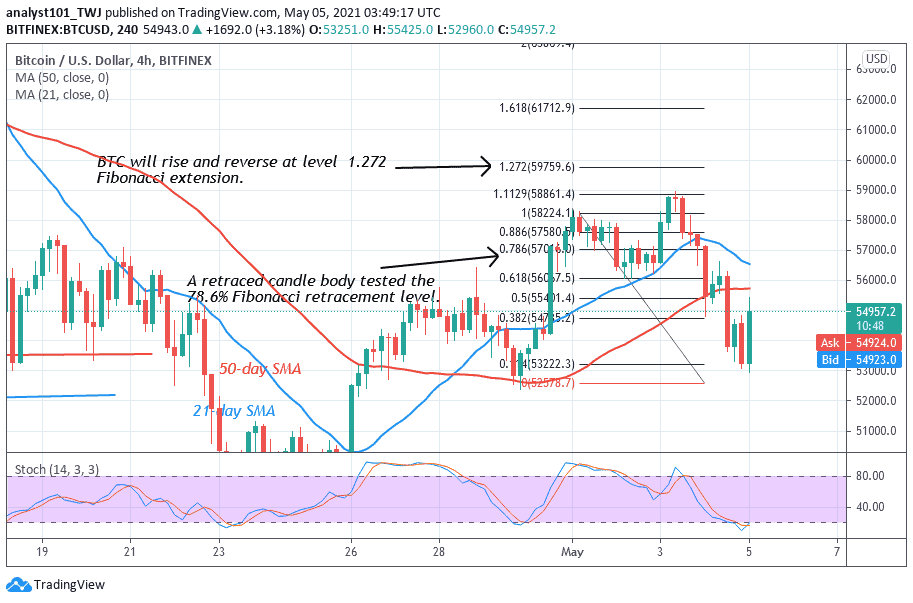
Bitcoin’s recent upward moves to the $60,000 price level have been repelled twice. BTC/USD price now struggles below the $58,000 resistance level. Today, BTC price has fallen to the low of $53,000 as bulls buy the dips. The king coin is still facing rejection after correction on the upside.
Resistance Levels: $65,000, $70,000, $75,000
Support Levels: $50,000, $45,000, $40,000
Following the last bearish impulse on April 23, the market declined to the low of $48,000. Buyers have difficulty in sustaining BTC prices above the $58,000 high. In the first week of May, buyers pushed Bitcoin to the previous highs on two occasions. On each occasion, the market would rise and retest the $58,000 resistance and fall. On May 1, the uptrend was interrupted as it fell to $56,000 support. Similarly, on May 3 the bullish momentum was terminated at the resistance as the market fell to the $54,000 support. Bitcoin is facing further selling pressure after the downward correction. The biggest altcoin is facing rejection at $55,500 high. If the bears succeed, the market will decline to the current support at $53,000. If this support is breached Bitcoin will revisit the $50,000 psychological price level.
CME Group Pioneer Micro Bitcoin Futures
The Chicago Mercantile Exchange, or CME, has officially launched its newest Bitcoin derivatives product. The new contract is worth one-tenth the size of a single Bitcoin. The Micro Bitcoin futures contract is worth 0.1 BTC, which provides traders with an additional tool to hedge their digital currency price risk. The CME launched its first-ever Bitcoin futures contract in December 2017 which made the cryptocurrency derivatives grow exponentially. According to reports, the cryptocurrency derivatives trades accounted for 55% of the overall markets in December 2020.

Bitcoin price has fallen and may likely continue the downward move. On the 4-hour chart, the BTC price is on a downward move. On May 1 uptrend. a retraced candle body tested the 78.6% Fibonacci retracement level. This retracement indicates that the market will rise and reverse at level 1.272 Fibonacci extension or the high of $59,759.60. Presently, the market has reversed from the high of $59,000 and a further downside is likely.


