Based on public data, by 2026, emissions from Bitcoin will be less than a third of what they are today and by 2031, there will be none.
Due to the level of publicly-available information about Bitcoin, you would think we’d get better attempts at analysis from critics. One of the most widely debunked, yet still widely referenced claims of “academia” is that Bitcoin will single-handedly increase the planet’s temperature by 2 degrees Celsius. By the end of this piece, you’ll see that the opposite is true, with Bitcoin’s emissions likely to have already peaked a few months ago, and that in 10 short years, it’s likely that Bitcoin won’t emit anything at all.
When one understands the basic fundamentals of business, competition and innovation, projecting future energy use of Bitcoin is trivial. Indeed, I and many others have done it with some degree of success in 2014, 2016 and 2018. I’m not able to see into the future this way because I’m necessarily wise or intelligent, I’m able to see into the future because Bitcoin voluntarily shows it to me. I just have to understand where to look.
The key to my “predictive successes” over the past seven years all boils down to a strong assertion that Bitcoin mining is the closest thing to a perfectly competitive market that has ever existed in the real world.
In the next sections, I will go through the basics of perfect competition and how miners tick as a result of this. I will then provide five- and 10-year predictions on price, hash rate and technology, and the energy mix of the Bitcoin network. From there, I will conclude with the total energy use and emissions of the Bitcoin network in 2026 and 2031.
Perfect Competition
The example of “the hypothetical firm in a perfectly competitive market” is taught in most introductory economics classes. A literature review of primary academic texts identifies nine conditions that define a perfectly competitive market.
In 2014 (page 35), I argued that only four of the conditions had been met. With the benefit of an additional 18 months of lived experience and data, I then argued, perhaps prematurely, that six of the nine conditions had been met (page three). Two and a half years later, in August 2018, we were still stuck at six (pages three to six). Another three years later, today, I’d be happy to say that seven conditions have now been met.
We will go through the nine conditions, very briefly, point by point. For a fully detailed analysis, you can revisit my earlier work linked above.
- Homogeneous products: Met.
- Guaranteed property rights: Met. Your keys, your coins. Your node, your rules
- Non-increasing returns to scale: Met. See GHash.io in 2014.
- Zero transaction costs: Met. See Lightning Network and Bitcoin Layer 3 as contemporary examples.
- Perfect factor mobility: Met. See recent seasonal and current China ban miner migrations as contemporary examples.
- No barriers to entry or exit: Met. Bitcoin is voluntary to enter/exit.
- Many buyers and sellers: I wanted to say “not met in the short term” on this one, but the data is suggesting that there are over 70 million Bitcoin users as at December 2020, which misses the past six months of mania that we just witnessed. It is arguable whether 70 million to 100 million users is actually that many, as the market is still illiquid enough to shed 50% of its value in a few weeks. Although there are “many buyers and many sellers,” the “many buyers, few sellers” and “few buyers, many sellers” scenarios still occur too frequently. Perhaps we’ll call this one “halfway met” in the short term, fully met within the next five years.
- Perfect information: Not met in the short term. While there are over 70 million Bitcoin users, the extreme volatility leads you to conclude that information is not yet perfect. There are still several insiders that get inside access during extreme market events, while retail investors panic sell in absence of this inside information. As we grow from 70 million users to 700 million users, this will stop being an issue. Indeed, most people still haven’t even heard of Bitcoin, let alone accessed any information about it. Most likely, this needs another five years to resolve, but not longer than 10.
- No externalities: Not met in the short term. Only externalities that exist are driven by the grid, not Bitcoin. All ASIC mining equipment is nearly fully recyclable. Further, ASIC equipment is now running for longer than ever due to slow hash rate growth (more on hash rate growth later!). As Bitcoin becomes the world’s flared methane sink, the externalities will be zero or negative. Most likely, this needs another five years to resolve, but not longer than 10.
Now that we have demonstrated that the nature of competition in Bitcoin is near perfect, we can discuss the significance of this assumption, and what it allows us to conclude when it comes to making five- and 10-year projections.
Perfect Competition And Miner Decision Making
The Porter’s five (or six) forces framework is a mainstay of the MBA curriculum. The forces within the Bitcoin mining market are illustrated below.
“Mapped out, prospects look quite daunting for an industry competitor. They cannot easily protect themselves from new miners or substitute products such as other digital currencies. [U]nless they are an innovation leader in the fields of hardware R&D and manufacture, data centre ownership, and/or electricity provision, they have little to no control over their suppliers either.”
This supplier power has been demonstrated by an almost complete lack of semiconductors being made available to produce new ASICs, which is likely to continue for two or three more years until more foundries are built. Competition is stiff within the mining industry, and a prompt extinction awaits if you are not a cost or innovation leader. This is expected — economic profit tends to zero in long-term equilibrium in a perfectly competitive landscape, and the marginal cost of producing and the market price oscillate around an equilibrium point, with evolution and improvement the only way to stay in business.
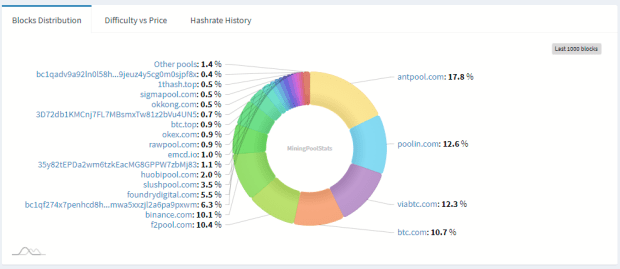
In such competitive markets, there is also a natural tendency for the market to be dominated by three or four players. The Pareto principle, also known as the 80/20 rule, states 20% of the market participants control 80% of the market. In November 2015, the five largest mining pools provided 79% of mining power. In June 2018, the largest five provided 70% of hash rate, with 78% of power coming from the top six. Now, it’s 63.8% for the largest five, and 73.9% for the top six. That said, the pools are not monolithic entities.
“In a perfectly competitive market, a firm’s decisions are highly predictable. All firms need to decide to start up, how to run their business as cost-effectively as possible, and whether to stay in business or not.
In the Bitcoin world, the decision-making process relies on the market price of bitcoin, operating expenditure, and the network hash rate. It also indirectly relies on the continued faith and investment of miners in the value of their commodity i.e., continued research, development, capital expenditure, and strategic partnerships with collaborators. The below figure shows the relationship between hash rate and price and shows the outcomes for miners in six different scenarios.
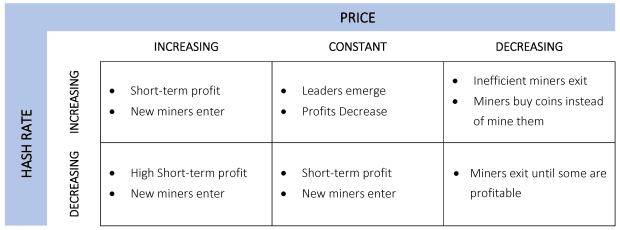
Effectively, if the price of the commodity increases beyond the cost to mine it, miners will enter the market until the price and cost are equal.
If price decreases, miners leave the industry until there are only profitable miners remaining.
If price is dramatically lower than cost to mine, some miners may elect to simply buy bitcoin until mining is profitable again.
If the market is flat, profit tends towards zero until the market is shaken up again.
This is similar to the workings of miners in the physical commodity and oil industries. The difference is that a Bitcoin firm’s decisions take hours and days to implement, and days and weeks to take effect, instead of months and years. The same is true regarding the time taken to reach equilibrium after a shock; ‘two-to-four times the duration of the production-to-storage cycle’ (i.e., months to years) for commodities, weeks for Bitcoin [based on the ~2-week difficulty cycle].”
Taking a look at the three-year hash rate history below, we see periods like October 2020, where the hash rate plummeted almost 50% in two weeks due to miners physically migrating within China to take advantage of cheap hydroelectricity during the wet season. Hash rate recovered completely in one month, or, around two difficulty cycles. The chart below is replete with examples of this seasonality. How many times do you remember seeing a “Bitcoin Mining Death Spiral” headline, only to see hash rate fully recover within two to four difficulty periods?
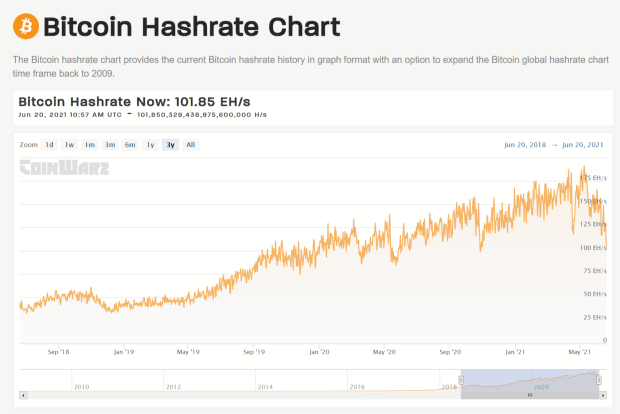
In recent weeks, China issued wholesale bans on mining, driving Bitcoin’s hash rate on June 20, 2021 temporarily back to levels not seen since late September 2019. Recall “perfect factor mobility” in perfectly competitive markets however, and most expelled Chinese hash rate should be back online within two to four difficulty periods, with the balance coming back online only a few more difficulty periods after that, considering the size of the task.
Now that we understand how competition in Bitcoin mining works, what makes miners tick, and the obstacles they face, we can very easily predict their behavior going five or ten years into the future. The only way to survive is through cost or innovation leadership, and this will almost always mean leadership in energy sourcing (OPEX) and hardware sourcing and/or design and manufacture (CAPEX). To be sure, miners are not environmentalists; but if clean energy is the cheapest energy available, that is what will power Bitcoin.
Predictions
Price Assumptions
People hate admitting it, but the only thing that matters in Bitcoin is the price. All else is absolutely secondary. I cannot impress upon you how important the price is. Developers aren’t important. Hardware providers aren’t important. Miners aren’t important. Nothing is. If the price doesn’t continue to rise, nobody is going to commit to mining or investing, and therefore, no devs, no software, no miners. To that end, the amount of energy dedicated to mining Bitcoin will be 100% dependent on the price of bitcoin, and the cost to mine it. During times of stability, such as during the absolute depths of a bear market, the cost to mine bitcoin is generally very close to the price. I am yet to meet anyone who has ever made an accurate bitcoin price prediction five days into the future, let alone five years into the future, so we will look at a few scenarios.
Price and hash rate have typically been very highly related, but with the recent and predicted-to-be ongoing chip shortages, hash rate and price may decouple, with the price-to-cost difference made up with hardware cost increases instead of deployment of more hardware.
For example, if the price of bitcoin is $30,000, and it costs miners $20,000 in OPEX to mine a bitcoin, then the market will necessarily price hardware so that the CAPEX component makes up the other $10,000. We are seeing this phenomenon right now. As can be seen in the secondhand ASIC market, the price of old Antminer S9 units is in near lockstep with bitcoin, with the last shipment of S9s leaving Bitmain’s factory at $90 each in late 2020, now fetching $300 to $400 on eBay. The pressure exerted by the invisible hand to reach price-cost parity will always be immense. Either way, one would expect a higher hash rate if the price is dramatically higher, all else considered.
Scenario One: 0% Annual Growth In Daily Demand
Whilst many think that bitcoin sees phenomenal daily volumes in the order of tens of thousands of BTC or billions in USD per day, the sad reality is that this is basically a group of 1,000 to 2,000 whales and entities wash-trading between each other, effectively just biding their time robbing naive retail investors with nausea-inducing swings until the next bull run. The net absorption of the daily inflation is absolutely critical, despite it being only 900 coins. At the current market price of around $30,000, the inflation to be absorbed yearly is 328,500 BTC, or, about $9.8 billion. All this takes is 2.7 million dedicated savers committing $10 per day in one of the many available automatic buying plans, and holding their bitcoin off an exchange in cold storage. The reason the “off exchange” aspect is so critical is because most of the wash-traded volume mentioned above isn’t even real, it’s mostly rehypothecated bitcoin or a futures product. If coins remain on an exchange, a fair assumption is that they are used for trading, as there are no proof-of-reserves requirements on the vast majority of exchanges, and other financial firms openly rehypothecate and state so in their terms and conditions.
These low numbers will either make you pessimistic about Bitcoin’s present, considering the trillions of freshly printed dollars sloshing around the legacy system. Alternatively, it could make you fiercely optimistic about the upside of potentially having 100 million retail investors saving $10 per day, quickly skyrocketing the price to well over $1 million dollars per coin, with $1 billion a day relentlessly crashing into a market producing only 900 new coins, and easily absorbing any excess being sold by speculators.
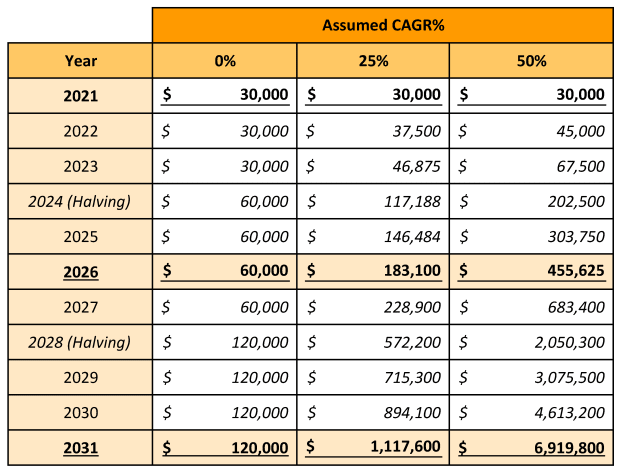
So, assuming 0% growth (but also 0% decline), the price will be $30,000 until the halving, where it will soon increase to $60,000 and stabilize until the next halving in 2028, where it will increase to $120,000, and remain so until 2032. Therefore, our “no-growth,” five-year (2026) price estimate is $60,000, and the 10-year (2031) estimate is $120,000, a market cap of just under $2.5 trillion.
Scenario Two: 25% Annual Growth In Daily Demand
One of my pet hates is hearing Bitcoin influencers talk about bitcoin returning 200% compound annual growth rate (CAGR) since inception, or 120% the past five years. These figures are only useful to those lucky enough to have bought once in 2010 at market inception, or once in 2015 to 2016 during the depths of the post-2013 bear market. It took exactly three years and four months for the price to never be below the December 2013 high of $1,175 again — CAGR = ZERO. The jury is still out on whether the 2017 high of about $20,000 has been passed once and for all or not.
The only acceptable CAGR figures must come from the humble regular saver. This is their performance over the past eight years (two halving cycles). It’s certainly not bad at all, but it is most certainly not 120% or 200% CAGR.
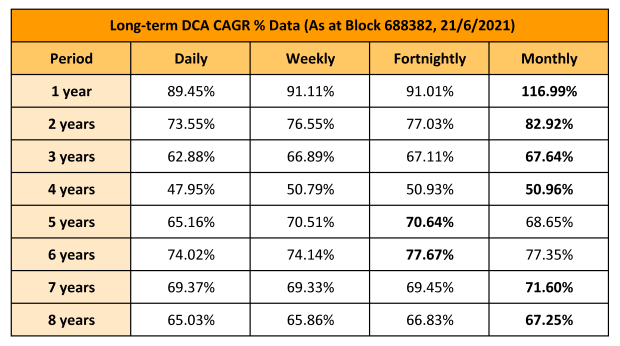
Let’s assume the absolute worst of the above performance results, the four-year annualized growth rate, about 50%, and halve it. This results in a price of $183,000 in 2026, and $1,118,000 in 2031, a market cap of around $23 trillion.
Scenario Three: 50% Annual Growth In Daily Demand
Since we assumed the worst of the long-term performance results above, this time, we will still assume so, but not halve it, and just go with a 50% annual growth rate. This results in a price of $455,000 in 2026, and $6,920,000 in 2031, a market cap of about $140 trillion.
Hash Rate And Technology Assumptions
In June 2018 (page nine), I compared the latest miner at the time, the Bitmain Antminer S9i, with the leading model in January 2015, the Antminer S5. In that 18-month period, ASICs increased their efficiency nine-fold, consuming only 98 watts per terahash (W/TH), down 89% from 890 W/TH in 2015. Three years on, and the Antminer S19j Pro achieves 29.5 W/TH, a further 70% reduction in energy. Although the aforementioned chip shortage will most definitely stifle supply dramatically for at least two more years, innovation will not be stifled, and I would assume an efficiency of 15 W/TH in 2026, and 7.5 W/TH in 2031.
In terms of overall hash rate, average growth rate has been on a downward trend for several years, while volatility in growth rate has been on an upward trend. This could be due to recent production and supply issues, seasonal migrations or that the installed base of ASIC miners is now so large that the marginal additions from new production are becoming less significant.
If the latter isn’t the case already, it likely will be in 2026, and most definitely will be in 2031. Anything more than average growth of 1% per difficulty epoch would be highly unlikely. That said, hash rate does follow the price, and if price is growing that dramatically, perhaps supply would appear. But, with even a “small fab” costing in the order of $12 billion and taking eight years to complete, it’s hard to see hash rate growing more than 1% per epoch regardless of price, certainly not for another two or three years. Perhaps in a “scenario three” situation where price rises so dramatically that chip producers will be compelled to prioritize the Bitcoin mining industry due to the sheer profitability, we may start to see extraordinary average fortnightly growth.
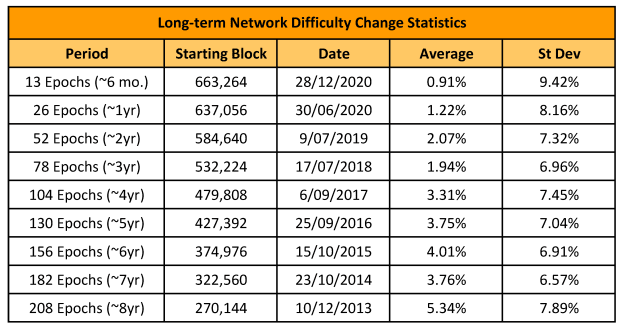
I will assume that by the end of 2021, all hash power evicted from China will be back online in another jurisdiction, and the year will end at a hash rate of 150 exahashes per second (EH/s). Assuming price growth scenarios one and two (0% and 25% per year, respectively), 1% growth rate in hash power every difficulty epoch is assumed. This gives us around 550 EH/s in 2026, and 2,000 EH/s in 2031.
In the case of scenario three panning out, we will assume 1% until 2024, and 1.5% from 2024 onwards on account of the resolution of the chip shortage and prioritization of the Bitcoin mining industry due to very high profitability. This gives us around 700 EH/s in 2026, and 4,900 EH/s in 2031. The key takeaway is that no matter how far price outstrips hash rate due to production limitations, the gap will be bridged through a natural increase in ASIC prices. In perfect competition, CAPEX + OPEX will always tend to the price of a bitcoin — no matter what.
On a separate note, a slow growth in hash power has the added benefit of equipment becoming obsolete much slower, extending equipment life, hence reducing environmental load.
Energy Mix And Price Assumptions
No need to make too many guesses on this one, the International Energy Agency (IEA) already has its 2030 targets in place in its “2020 Energy Outlook.” Here are the highlights:
“Primary energy demand in the Net Zero Emissions by 2050 (NZE2050) scenario falls by 17% between 2019 and 2030. Coal demand falls by almost 60% over this period to a level last seen in the 1970s. Emissions from the power sector decline by around 60%. Worldwide annual solar PV additions expand from 110 GW in 2019 to nearly 500 GW in 2030, while virtually no subcritical and supercritical coal plants without carbon capture (CCUS) are still operating in 2030. The share of renewables in global electricity supply rises from 27% in 2019 to 60% in 2030, and nuclear power generates just over 10%, while the share provided by coal plants without CCUS falls sharply from 37% in 2019 to 6% in 2030.”
IEA also says that, “Electricity meets 21% of global final energy consumption by 2030.” So, we know that primary energy demand in 2019 was 173,340 terawatt hours (TWh), and that this will decrease by 17% by 2030 to 143,870 TWh, and electricity makes up 21% of this, or, 30,210 TWh. The world’s grid intensity was 463 grams (g) of carbon dioxide equivalent per kilowatt hour (CO2e/kWh) in 2019, targeting around 240 g CO2e/kWh by 2030 in line with the IEA sustainable development scenario.
Accounting for all of the above, we will assume a linear improvement from 2019 to 2030 to extrapolate the world average energy mix and intensity in 2026 and 2031, as shown in the tables below.
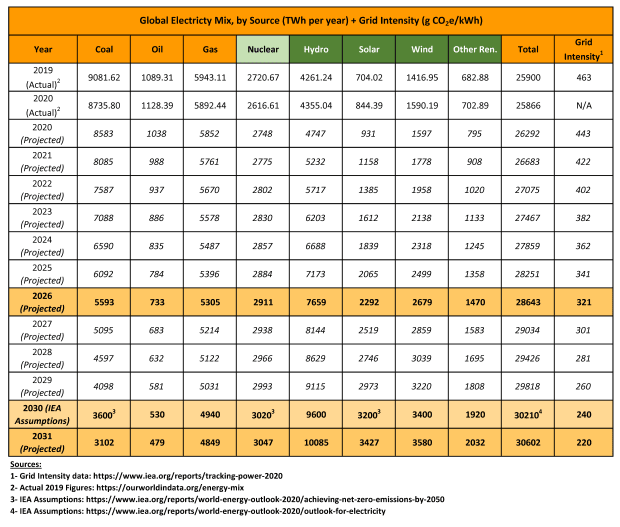

Since Bitcoin is currently cleaner than the world average grid (418 g versus 463g CO2e/kWh), and considering the China ban, Bitcoin is currently very easily over 50% total renewables, also known as “The Elon Threshold.” I predict that due to offset emissions from prolific use of flared methane to mine bitcoin, as well as Bitcoin being agile enough to move to the cheapest (i.e., cleanest) energy sources — whether it is a remote oil field or volcano — the carbon intensity of Bitcoin in 2026 will be 100g CO2e/kWh, and by 2031 it will be zero (or negative).
Energy Use And Emissions
We now have the following two scenarios, the associated assumptions and their final energy use and emissions. Current data is based on cbeci.org, as at June 23, 2021, per the screenshot shown below.
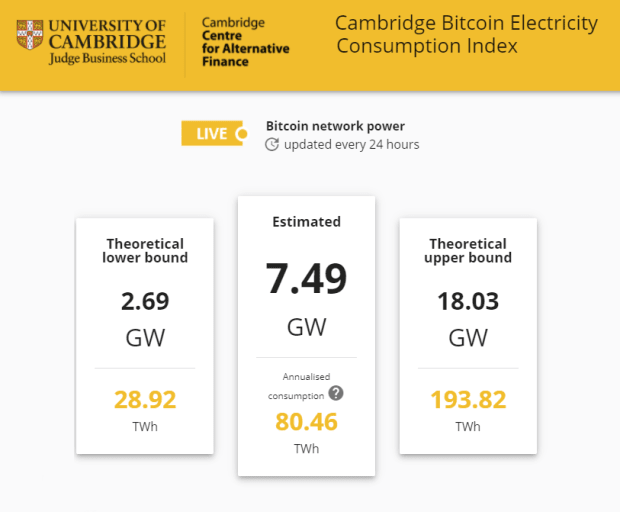
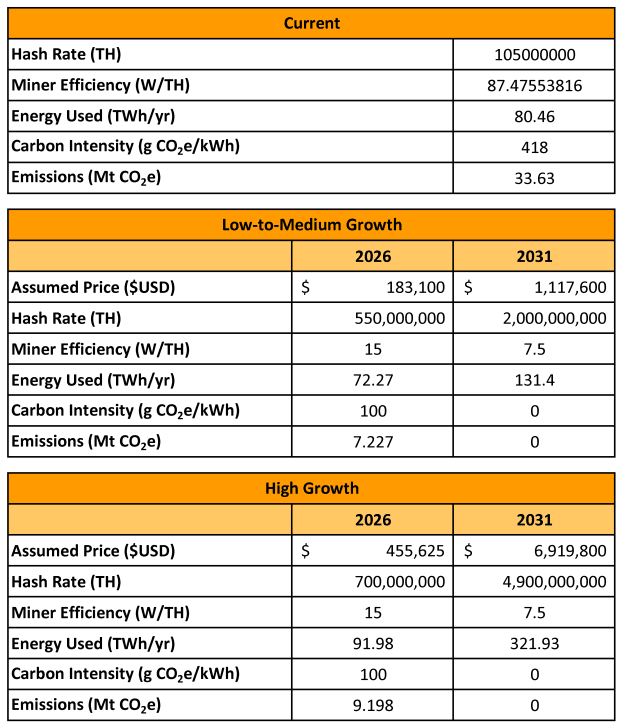
From the above, it would appear that Bitcoin’s emissions peaked a few months ago, and thankfully, with the banning of Bitcoin mining in China, has commenced its aggressive march down to zero emissions. It is expected that in the worst case, emissions from Bitcoin in five years will be less than a third of its emissions today, and in 10 years, Bitcoin will emit nothing at all.
While this may seem counter-intuitive, when all of the data is aggregated and assessed with logic and textbook business and economic frameworks, it can be easily seen that Bitcoin poses almost no threat to the environment. Indeed, in the best case, Bitcoin will actively heal the environment through offsetting of flared methane and by holding the key to an abundant, clean energy future. I look forward to revisiting this prediction in 2026!
This is a guest post by Hass McCook. Opinions expressed are entirely their own and do not necessarily reflect those of BTC Inc or Bitcoin Magazine.


