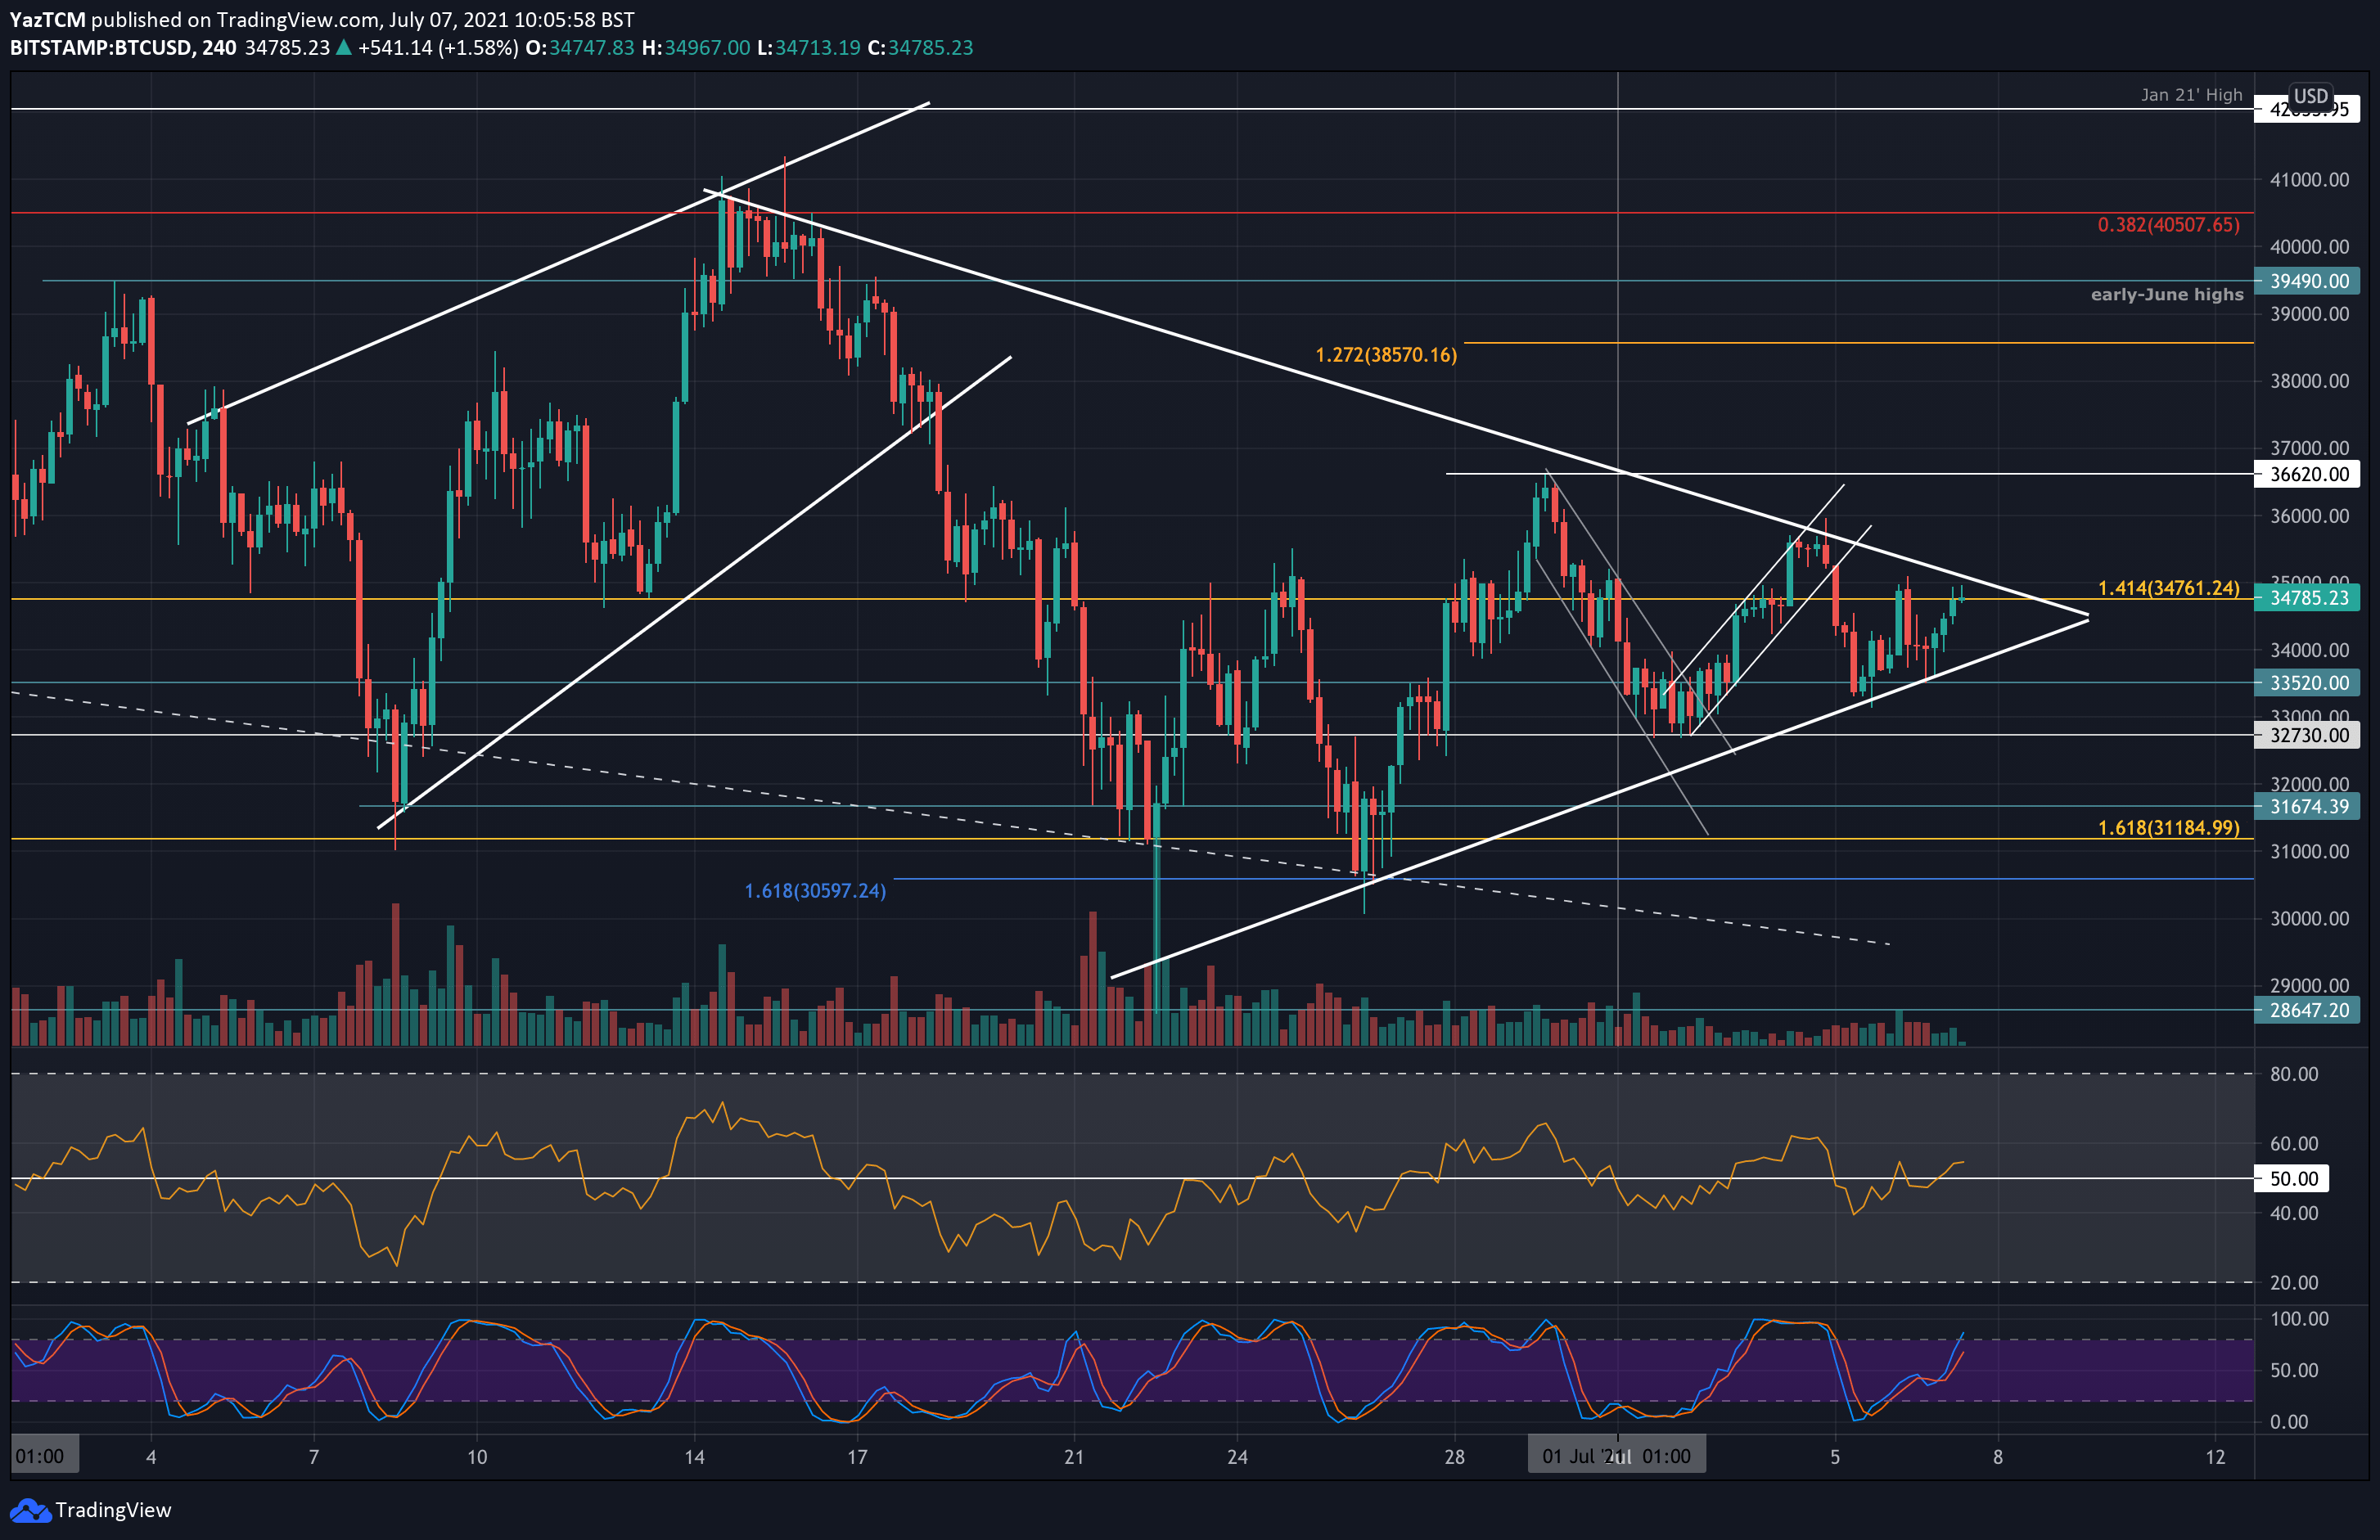
BTC continues the drawn-out phase of consolidation as it trades sideways inside a short-term symmetrical triangle pattern. It looks as BTC awaits the next huge move as the apex of the triangle draws near – in a matter of days or even hours, and the trading volume decreases, which typically happens before a massive move.
Quick recap: Bitcoin tested the upper boundary of the symmetrical triangle earlier in the week but failed to surpass $35,600 – $36K. From there, it headed south and found support at the lower angle at around $33,500. It has since rebounded, and as the coin continues to coil inside the triangle pattern.
On the larger time frame, BTC reclaimed the 20-day MA, which currently lies around $34.3K, and is once again testing resistance at the upper angle of the triangle, which dates back to the mid-May capitulation.
Additionally, there is a rising trend line beneath the market established in the final weeks of June. The confluence of these forms the triangle that is currently in play. The price consolidates for the past 2.5 weeks around the $33-34K mark.
Lastly, it is important to mention that the RSI is also amid a critical decision as it is retesting the mid-term descending trend line, as can be seen on the following daily chart. This resistance has prevented the RSI from creating any new higher highs since its establishment back in February this year. A break above this line, along with the first higher low, might signal a new short-term move for bitcoin.
As always, in the longer timeframe and since mid-May, Bitcoin price is trapped between $30K and $42K. A breakout from this range could lead to the next big move of the primary cryptocurrency.
BTC Price Support and Resistance Levels to Watch
Key Support Levels: $34,300, $33,500, $32,700, $31,675, $31,185.
Key Resistance Levels: $35,000, $36,000 – $36,620, $38,000, $39,500, $40,500.
Looking ahead, if the buyers break the $35K resistance, the next major resistance lies between $36,000 (50-day MA) and $36,620 (late-June highs). This is followed by $38,000, $39,500 (early June highs), and $40,500 (bearish .382 Fib).
On the other side, the first support lies at $34,300 (MA-20 line). This is followed by $33,500 (lower angle of the triangle), $32,700, $31,675, and $31,185 (downside 1.618 Fib Extension).
As mentioned, the daily RSI is retesting a long-term descending trendline. A break above this would be huge for the bullish case. On the 4-hour chart, the RSI needs to pass the 60 level to indicate increasing momentum.
Bitstamp BTC/USD Daily Chart
Bitstamp BTC/USD 4-Hour Chart


