Bitcoin analysis
Bitcoin’s support resistance at $33k is becoming a bit legendary after weeks of respecting that price. BTC’s been inside its current range of $30k-$35k for 3 weeks already and the larger trend of $29k-$41k for months.
The sentiment across social media is very much split still about whether bitcoin is currently in a bull or bear trend.
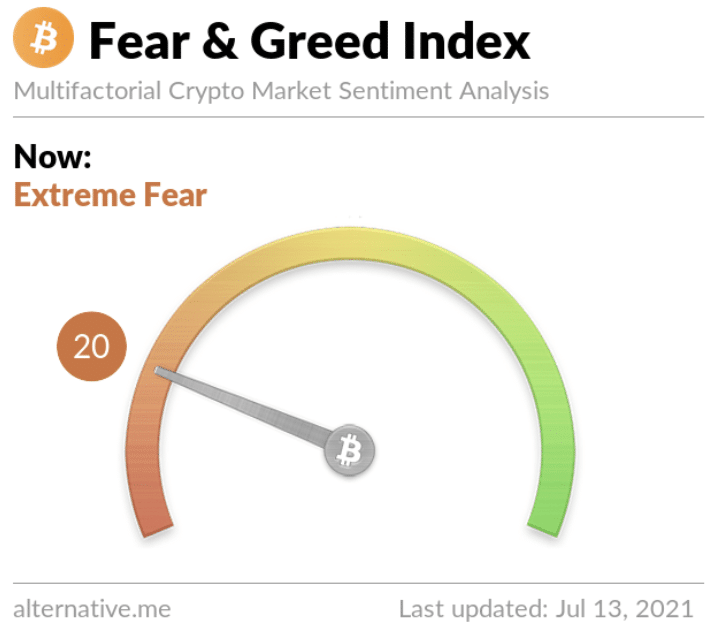
The Fear and Greed Index metric for bitcoin sentiment is at 20 for July 13 – down 5 points from Monday’s reading of 25.


The above chart from AtlasTrades shows bitcoin at the bottom of an ascending wedge on the 2hr timeframe. It looks quite similar to other timescales as well and $33k has been a true war between bulls and bears for an extended amount of time.
Over the next few weeks traders should really have more knowledge about the hand they’ve been dealt for the second half of 2021.
One indicator that BTC’s trend could be in the process of a bullish reversal with continuation to the upside is the recovery of bitcoin’s hash power. BTC hash power bottomed at 83m. BTC’s peak during the uptrend was 180m before Chinese miners shut off their rigs and triggered a 53% decline.
Since bitcoin’s hash power bottom it’s rallied nearly 20% back to 100m. This figure puts BTC just under the level it was before it’s massive rally to end 2020 and begin this year.

Bitcoin’s 24 hour range is $32,600-$34,655 and the 52 week range is $9,092-$64,374.
BTC closed Monday’s daily candle worth $33,090 and in red figures [-3.36%].
Polygon [MATIC] Price and Trends
MATIC began its final 4hr candle on Monday, bleeding in red figures [-6.8%]. Support resistance around $1.00 had been extremely strong for weeks but was cracked after weak buying pressure over the last few days from Polygon bulls.
While Polygon is thought by most to be a layer-2 solution to Ethereum, some believe that the Polygon network is acting as a layer-1 of its own and is actually a competitor to Ethereum and other layer-1 smart contract platforms.

The continuous integrations by Polygon have bulls on this project excited but will the price follow the news in the coming months?

The above chart from Big_Mike716 of TradingView shows how tight MATIC accumulation has been on the daily timescale. A break back above this structure could send the price back to $1.20 before looking for further confirmation to the upside.
The downside scenario looks like a breakout of the current sideways accumulation and bearish continuation. If a trip to lower figures happens bulls will look to $.81 on the daily chart for support resistance.
Polygon’s 24 hour range is $.963-$1.05 and 52 week range is $.022-$2.62.
Polygon’s average price for the last 30 days is $1.19 [-26.31%].
Matic closed Tuesday’s daily candle at $.996 and in red [-4.36%].
The post Bitcoin [BTC] and Polygon [MATIC] Price and Trend Analysis appeared first on The Cryptonomist.

![You are currently viewing Bitcoin [BTC] and Polygon [MATIC] Price and Trend Analysis](https://digitalcurrencyresearch.io/wp-content/uploads/2021/07/bitcoin-analysis-2.jpg)


