Bitcoin analysis
Bitcoin traded mostly sideways but finished in red digits on Tuesday after touching the high $37k level and inevitably finding support resistance at that level. The bitcoin price closed Tuesday’s daily candle just -2.42% and in red digits for the 4th consecutive day.
Bitcoin’s 4hr chart shows the asset hinting at bullish divergence at the time of writing.
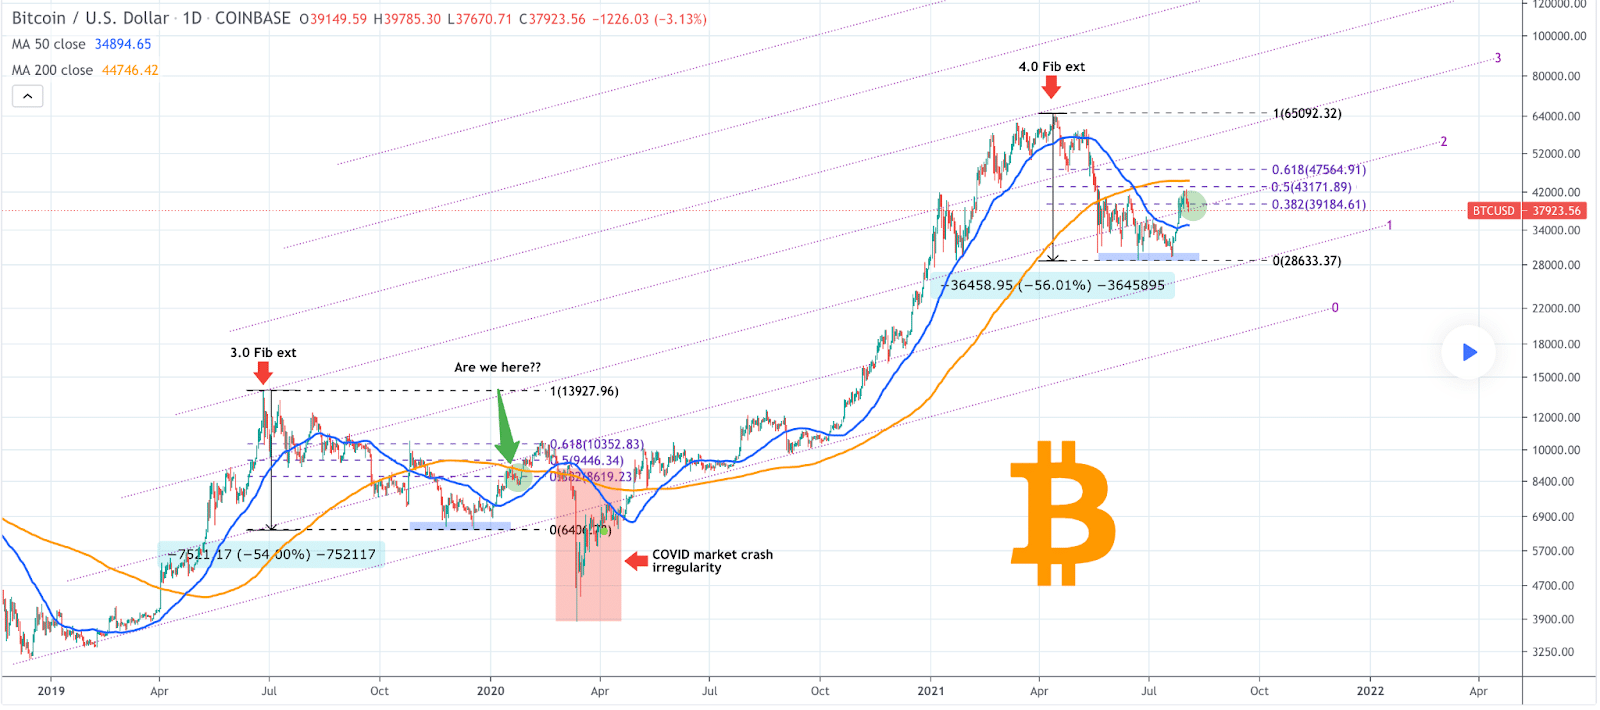
Below is BTC’s 1D chart from TradingShot that shows the 1W MA50 held through the downtrend and has rallied over the past two weeks now.

If BTC can continue to hold the 1D MA50 and break the 1D MA200 it could be setting up for the fall and winter many bulls have been expecting for years.
If bears have their way they will push the price below $38k and get a close on a substantial timescale. Bitcoin’s price above $36k is an important level to hold for bulls, bears will continue to aim to break that level in the short term.
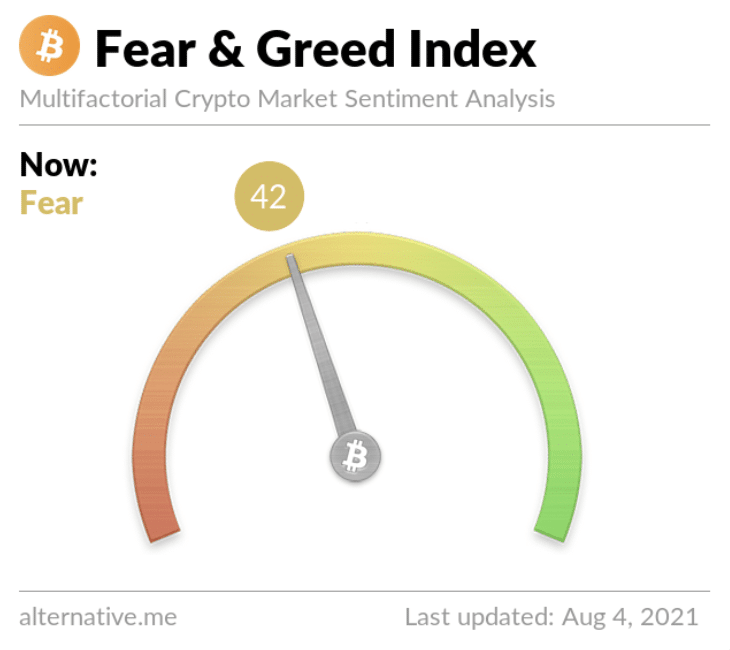
The Bitcoin Fear and Greed Index is reading 42 and -6 points from yesterday’s reading.

BTC’s 24 hour range is $37,663-$39,781 and the 7 day range is $37,663-$42,628. Bitcoin’s 30 day average price is $34,916 with a low of $29,341.
Bitcoin closed Tuesday’s daily candle worth $38,207.
Polkadot Analysis
It was announced this week the Polkadot network is going to be the launchpad for a United Nations NFT art project to encourage the ease of climate change. With Ethereum’s success and then Binance Smart Chain’s success with NFT’s it will be interesting to see how much traction Polkadot gets in that realm and whether news like this will increase DOT’s market share.
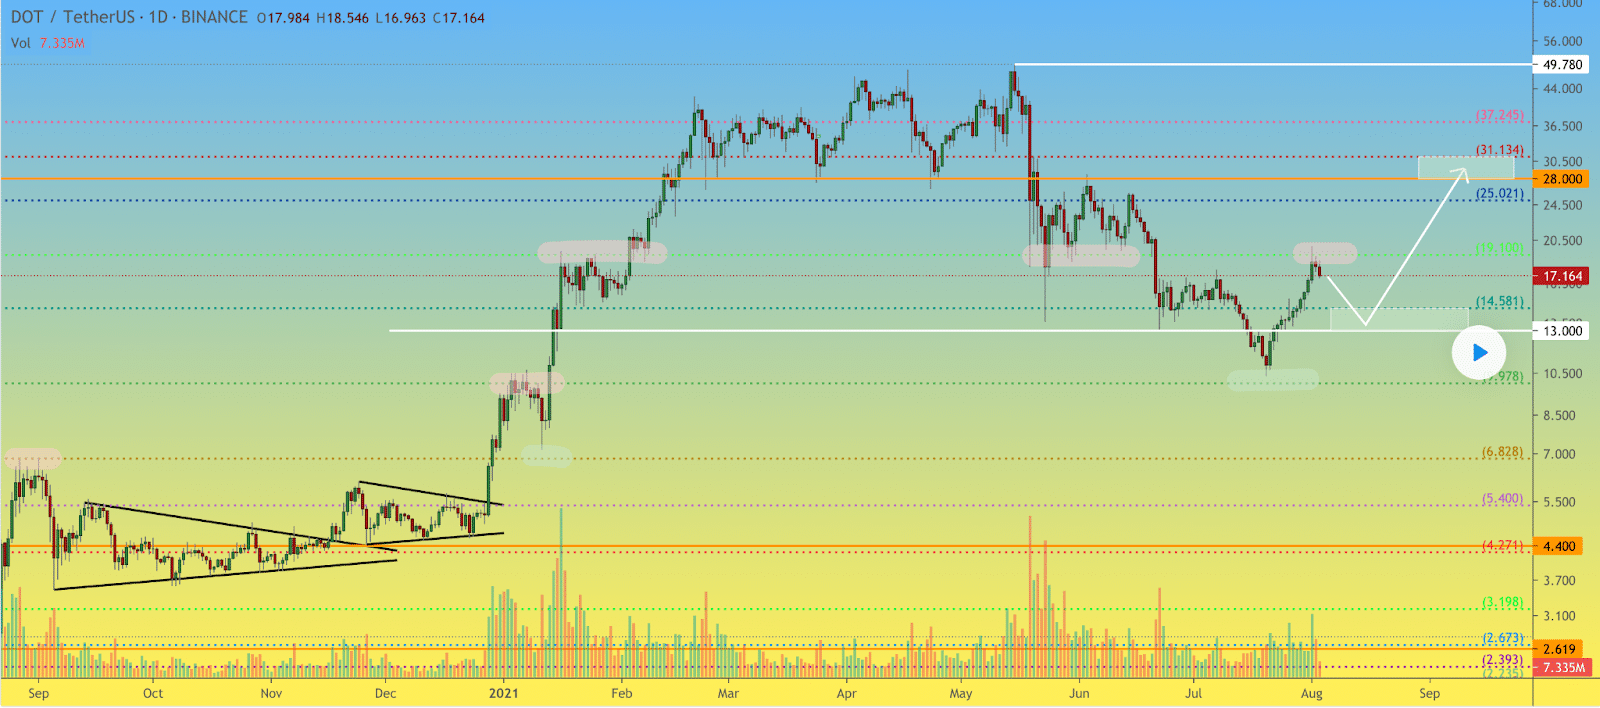
As you can see on the chart below from P_S_trade Polkadot’s currently in an extremely sound technical uptrend. The asset has strong support around $13. If bears are able to gain some momentum back they could push the price back to that level to test recent lows.

The bulls however will look to carry on and lift the price to the mid $20’s where there’s a lot of historical overhead resistance to take out before $30 is overtaken.
If bulls are successful in sending DOT’s price higher after $30 there’s not a lot of chop on the chart before the all-time high of $49.35.
DOT’s 24 hour range is $17.12-$18.25 and the 7 day range is $14.03-$19.56. Polkadot’s 30 day average price is $14.67.
DOT closed Tuesday’s daily candle worth $17.36 and in red figures for 2nd consecutive day.
The post Bitcoin ($38K) and Polkadot ($17.36) Price Analysis appeared first on The Cryptonomist.


