Bitcoin Price Prediction – August 10
The market activity involving Bitcoin and the US Dollar presently pushes higher past the line at $45,000. As of writing, the crypto economy trades around the level of $46,422 at a percentage rate of -0.11.
BTC/USD Market
Key Levels:
Resistance levels: $50,000, $52,500, $55,000
Support levels: $42,500, $40,000, $37,500
BTC/USD – Daily Chart
The BTC/USD daily chart shows that the crypto market pushes higher past the line of $45,000. Price continues adding pressures to the upside within the bullish channel trend-line. The 14-day SMA trend-line touches the 50-day SMA trend-line beneath. The Stochastic Oscillators have closed the lines around the range 80, seemingly attempting to cross southbound. That signifies that the crypto may pause movements for a while in the bullish channels.
Would there be a further increase in the crypto’s valuation as the market pushes higher?
There can be furtherance in the crypto’s price as the BTC/USD market pushes higher past the line of $45,000. Bulls should have to continually re-position against any force that may abruptly occur. However, the strength maintained to the upside appears less-weighty. The level at $42,500 presently turns the main support line that the trade may not reverse.
On the downside analysis, the ETH/USD bears needed to look out for price action rejection around $47,500 to get decent cell entry. If that presumed play out accordingly, the line at 445,000 will breach southward to achieve lower value. The touching of the bigger SMA from beneath by the smaller SMA around the level at $40,000 suggests that it will still be necessary that the market witness a pull-down, trying to push for more higher-ups.
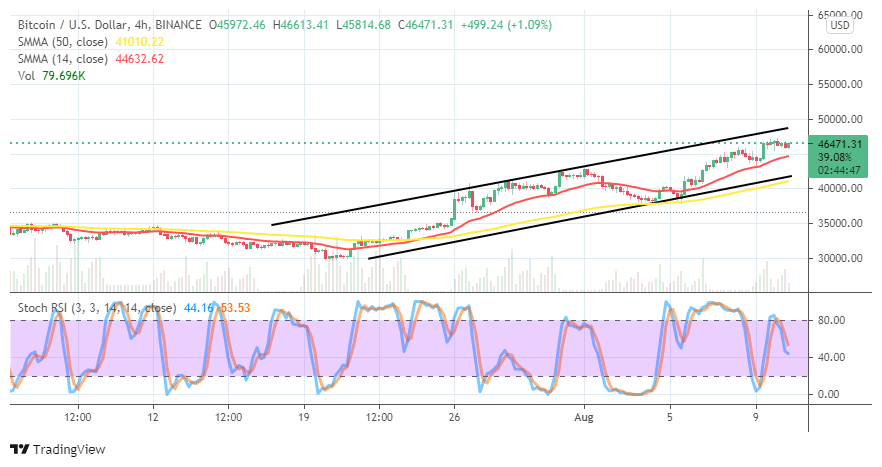
BTC/USD 4-hour Chart
The BTC/USD 4-hour chart reveals that the crypto market pushes higher in the well-defined bullish channel trend lines. The 14-day SMA trend-line is above the 50-day SMA trend-line. And, they both point toward the north direction to indicate that some degrees of buying pressures are ongoing. On the contrary, the Stochastic Oscillators have crossed southbound near the range at 40. Yet, they point to the downside, signaling a return of falling force in the crypto trading activities.
Looking to buy or trade Bitcoin (BTC) now? Invest at eToro!
75% of retail investor accounts lose money when trading CFDs with this provide


