Bitcoin analysis
Bitcoin’s ascent over the last 3 weeks could be setting the world’s preeminent digital asset and macro crypto sector up for a legendary close to 2021.
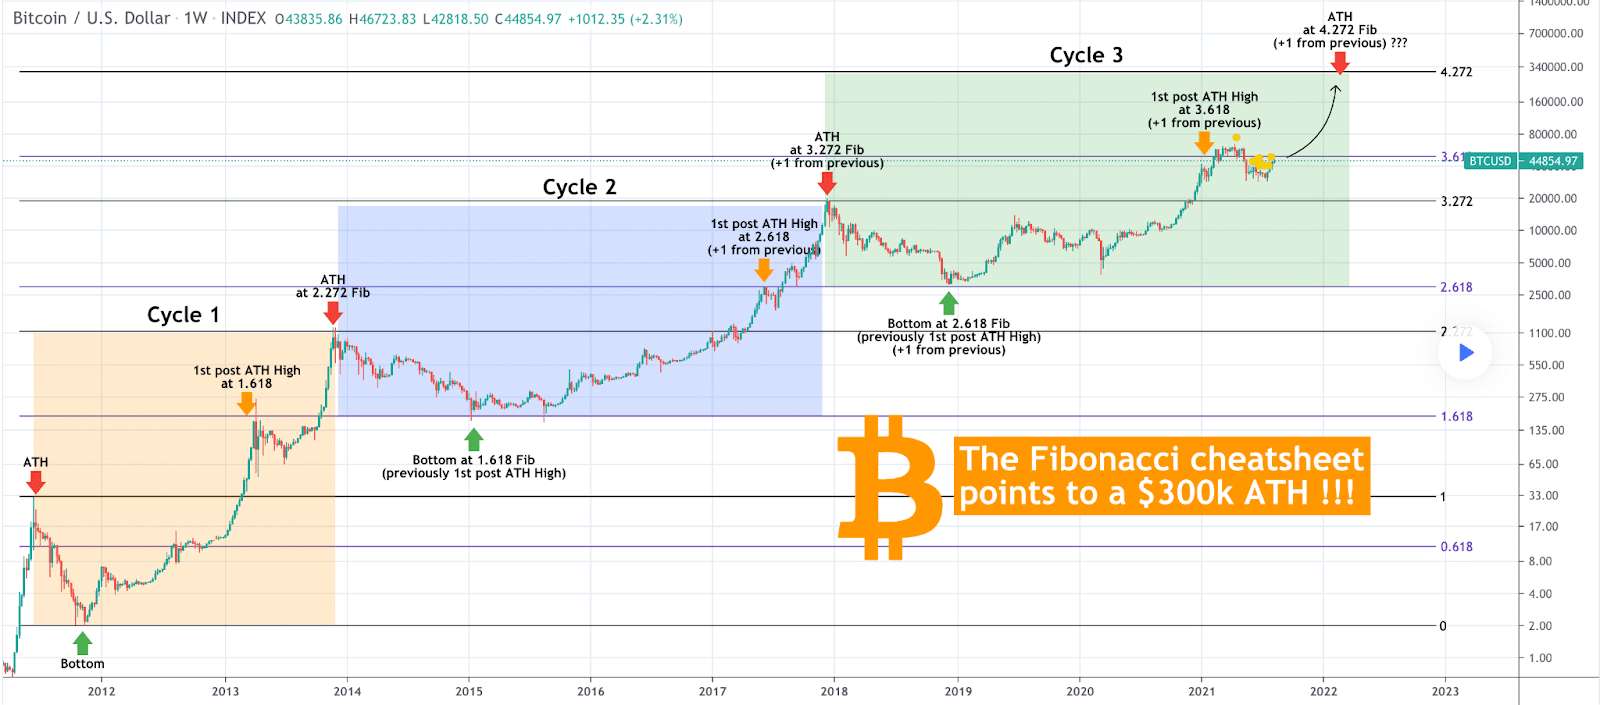
The 1W BTC chart below accounts for bitcoin’s prior cycles and uses fibonacci to predict this cycle’s peak price. TradingShot’s chart below has BTC potentially peaking at $300,000 when this current bullish cycle concludes.

The above chart denotes that if history repeats this cycle should end on the 4.272 Fib which would be 1.0 higher than the last cycle and continue the trend of ending 1 Fib level higher than the previous cycle.
Cycle 1 concluded at the 2.272 Fib level and cycle 2 concluded at the 3.272 Fib level.
A cycle 3 conclusion at the 4.272 Fib level puts BTC’s price at $300,000 if this cyclical pattern continues yet again.
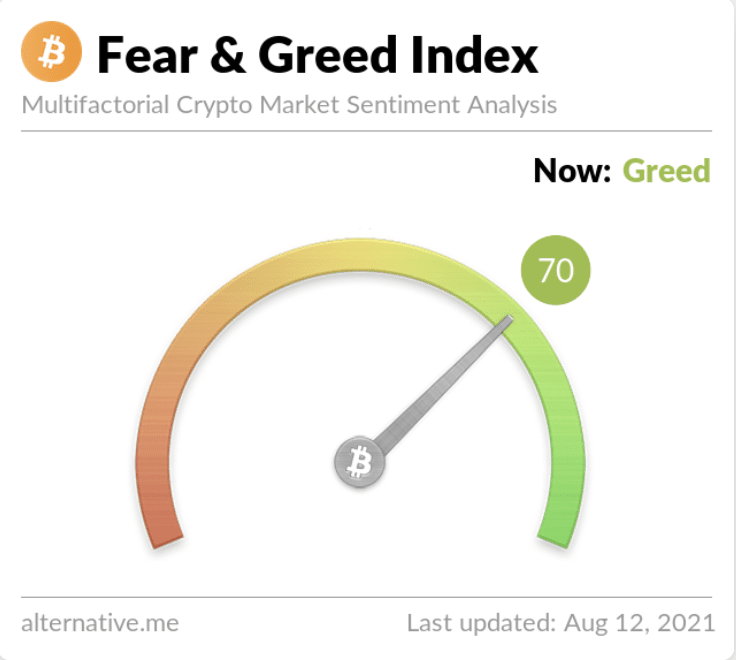
The Fear and Greed Index is reading 70 and equal to yesterday’s reading.

Bitcoin dominance accounts for 43.6% of the aggregate crypto market capitalization that closed at $1.96 trillion on Wednesday.
BTC’s 24 hour range is $45,241-$46,727 and the 7 day range is $37,595-$46,727. Bitcoin’s 30 day average price is $37,344.
Bitcoin closed Wednesday’s daily candle worth $45,546 and in red figures by a razor margin of -0.14%.
Cardano Analysis
While there’s an ongoing debate currently around whether Cardano is providing much utility to the space, there’s no debate the market is finding value in this asset at least as a speculative tool.
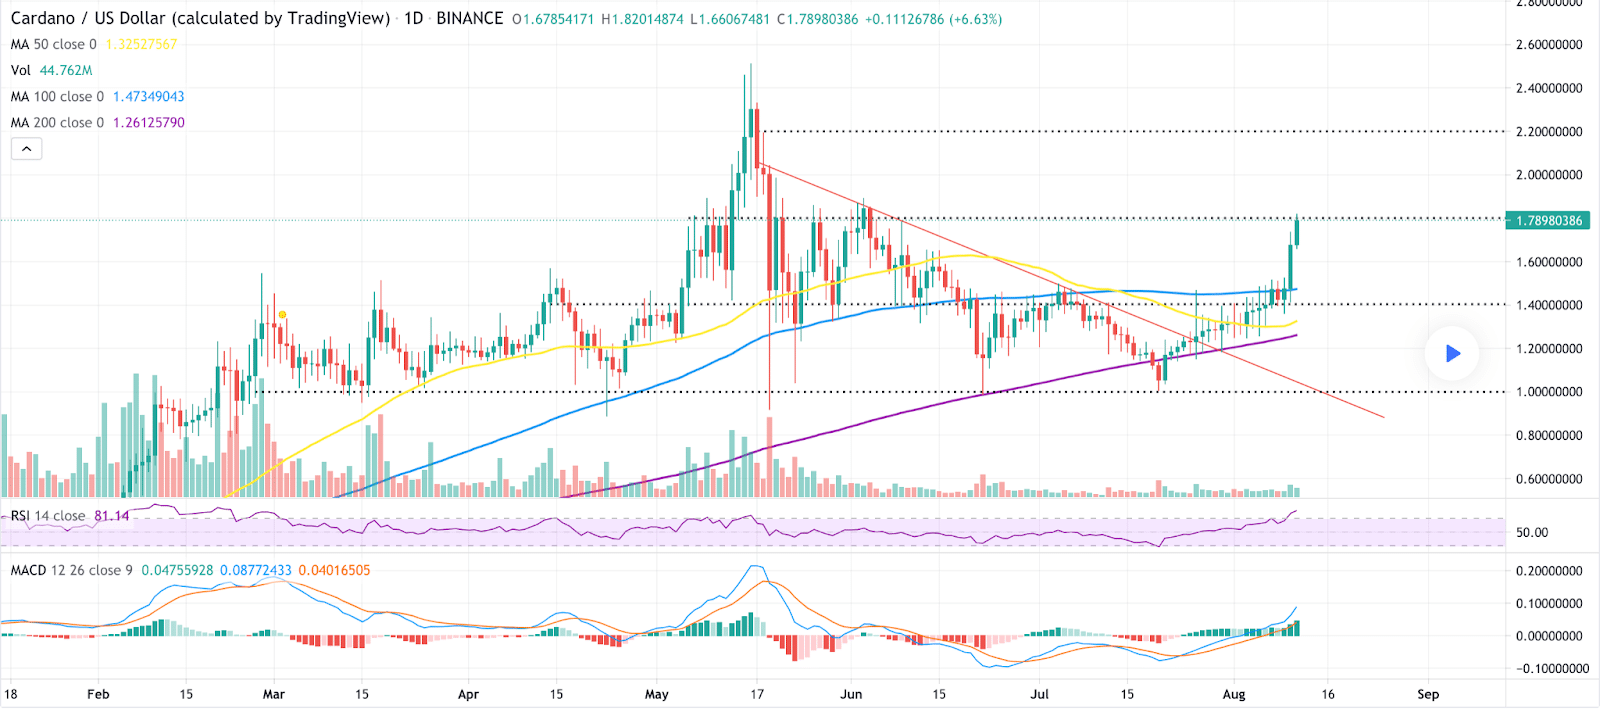
Cardano’s back above all three crucial moving averages, the MA 50, the MA 100, and the MA 200. This is an extremely bullish indicator even if moving averages can often be lagging indicators of bullish or bearish price reversals.
The below chart from CoinGape shows just how bullish the price action over the last week’s been on the crypto sector’s #5 asset by market capitalization.

Cardano bulls have their sights set overhead at $2.00 and if they can hold the price above $1.78 for long enough that level could be tested. Above $2 bears will certainly be aiming to mark-up the price quickly to a new all-time high above the current one of $2.45.
If bears are going to put up any sort of stand against ADA bulls in the interim they’ll need to push the price back inside the prior busted range and then back below that supply line at $1.23.
ADA is +1,224% for the last 12 months against the U.S. dollar, +229% against BTC and +57.33% against ETH at the time of writing.
Cardano’s 24 hour price range is $1.67-$1.89 and the 7 day price range is $1.35-$1.89. ADA’s 30 day average price is $1.30.
ADA [+7.22%] finished Wednesday’s daily candle worth $1.79 and in green figures for a third consecutive day.
The post Bitcoin and Cardano Price Analysis and Trends appeared first on The Cryptonomist.


