
Bitcoin Price Prediction – August 14
At the moment, the Bitcoin price prediction reveals that BTC is seen dropping over 1.92% after touching the daily high of $48,149.
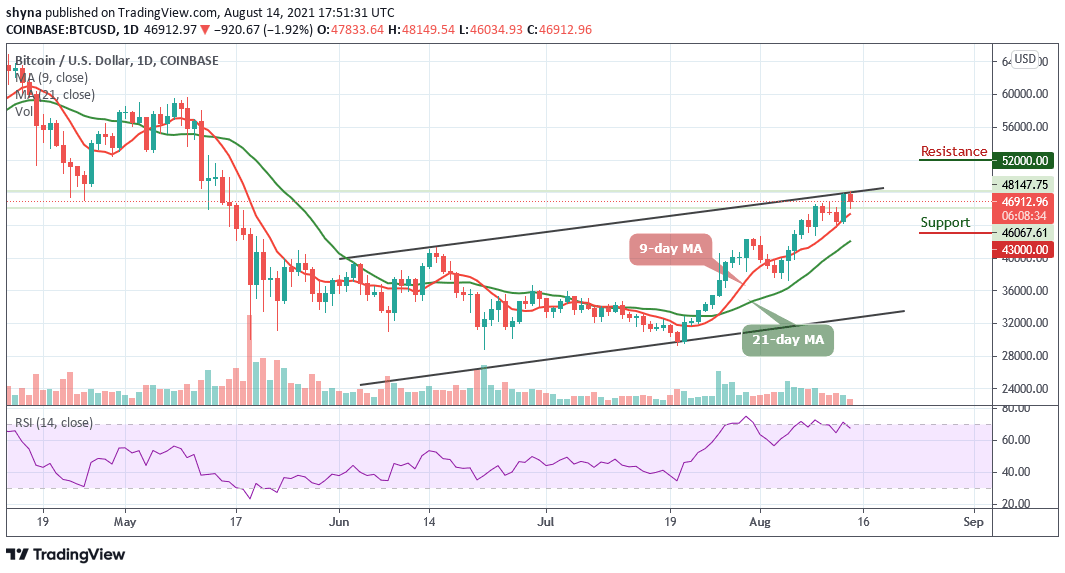
BTC/USD Long-term Trend: Bullish (Daily Chart)
Key levels:
Resistance Levels: $52,000, $50,000, $48,000
Support Levels: $43,000, $41,000, $39,000
According to the daily chart, BTC/USD failed to break above the previous resistance level of $48,000 as the king coin begins the day off by trending lower toward the $45,000 level inside the channel. However, if the Bitcoin price continues to drop further, the first support level may be located at $45,000. Beneath this, critical support lies at $43,000, $41,000, and $39,000 levels.
Bitcoin Price Prediction: Bitcoin (BTC) May Drop Further
The Bitcoin price fails to cross above the upper boundary of the channel as it looks to set up another few days of negative price declines beneath $45,000. Meanwhile, a break above the opening price of $47,833 would have set the first digital asset up to reach the nearest resistance at the $48,500 level. In other words, traders continue to see Bitcoin falling towards the 9-day moving average as the technical indicator Relative Strength Index (14) is likely to fall more.
Moreover, the Bitcoin price may not be above to go higher as it is seen retreating towards the 9-day moving average and the current candle is yet to close and it is unlikely that the bulls may end up closing above it. More so, should the technical indicator moves below 60-level, the market price may end within the negative side but on the contrary, moving towards the upside could meet the resistance levels at $52,000, $54,000, and $56,000.
BTC/USD Medium-Term Trend: Bullish (4H Chart)
Looking at the 4-hour chart, the bears are seen coming back into the market as the bulls failed to defend the $47,026. However, the $45,000 and below may come into play if the bearish momentum increases the market movement.
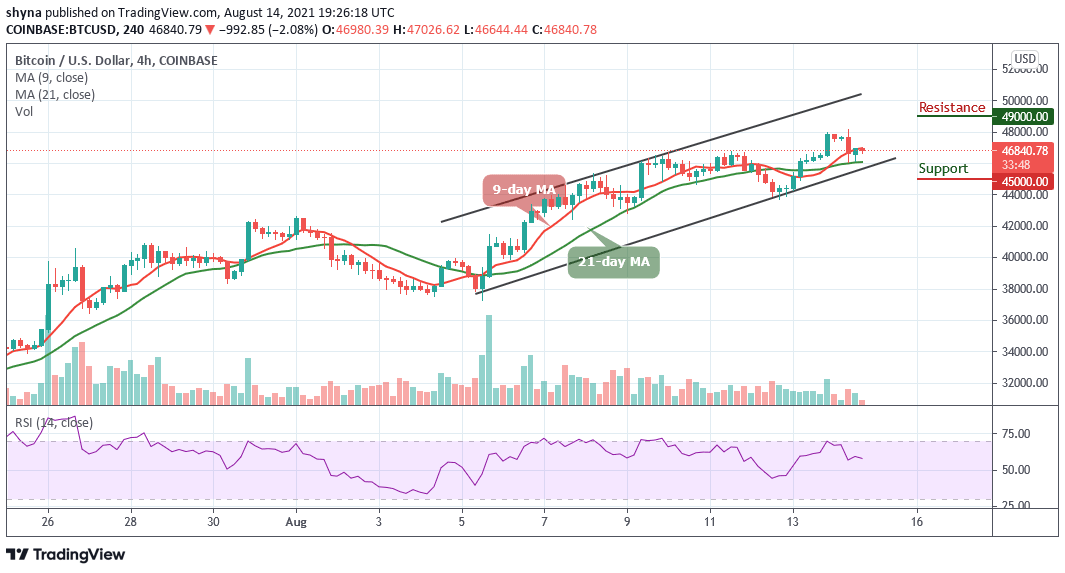
However, if the buyers could push the current level upward, traders may expect a retest at a $48,000 resistance level; breaking this level may further allow the bulls to hit $49,000 and above. At the moment, the technical indicator Relative Strength index (14) signal line is seen moving below 60-level which could give additional bearish signals in the near future.
Looking to buy or trade Bitcoin (BTC) now? Invest at eToro!
75% of retail investor accounts lose money when trading CFDs with this provider


