
Bitcoin Price Prediction – August 21
The BTC/USD market operation averages $50,000 as the price keeps the trading situation in the bullish channel trend-lines. The crypto’s percentage rate of trading is put at -0.88 to trade around the $48,911 line.
BTC/USD Market
Key Levels:
Resistance levels: $52,500, $55,000, $57,500
Support levels: $45,000, $42,500, $40,000
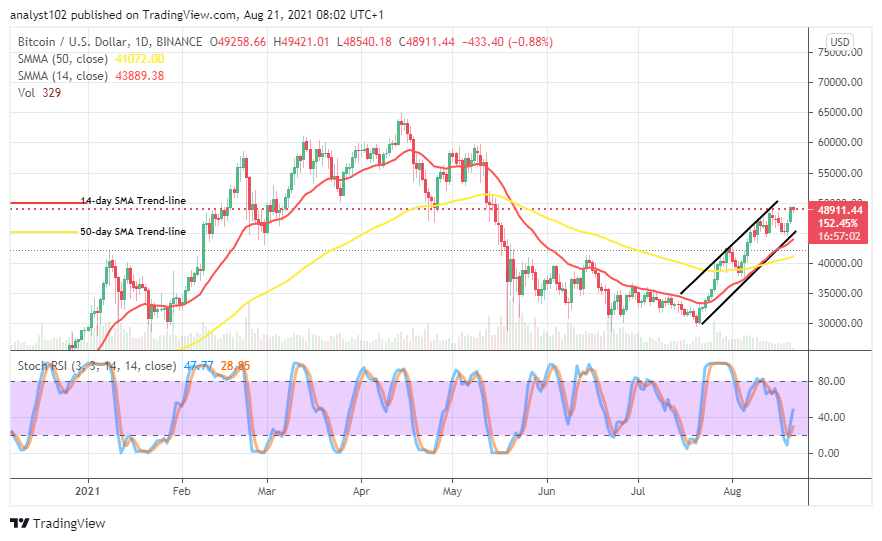
BTC/USD – Daily Chart
A bullish candlestick emerged during yesterday’s session, signaling on the BTC/USD daily chart that the crypto market operation averages $50,000. The bullish channel trend lines drew systemically past the points at $50,000 and $45,000 briefly to the north side. The 14-day SMA indicator trends northward close below the lower value mentioned earlier as the 50-day SMA indicator places underneath it. The Stochastic Oscillators have crossed the lines northbound from range 20 briefly past range 40. That signifies that an upward pressure dominates the crypto-economic pace currently to some extent.
Will the BTC/USD price surge higher as the market operation averages $50,000 level?
The indication on grand gives it out that there is every tendency that the BTC/USD price will surge higher as the market operation averages $50,000 level. An aggressive breakout is required to occur against the point so that new higher trading zones achieve above the present zones of $50,000 and $45,000. However, if the price eventually protrudes northward to a higher trading line for either a touch or a line of rejections, that may lead to momentum loss.
On the downside, the BTC/USD market bears should wait for a decent price set-up characterized with variant rejections or several convergences of the price at a higher trading spot that eventually coupled with a visible drawdown to consider the launching of a sell position. The outlook posture of the Stochastic Oscillators’ readings portends a warning against going short on the market at that point of trading spree without factoring in the direction of price action.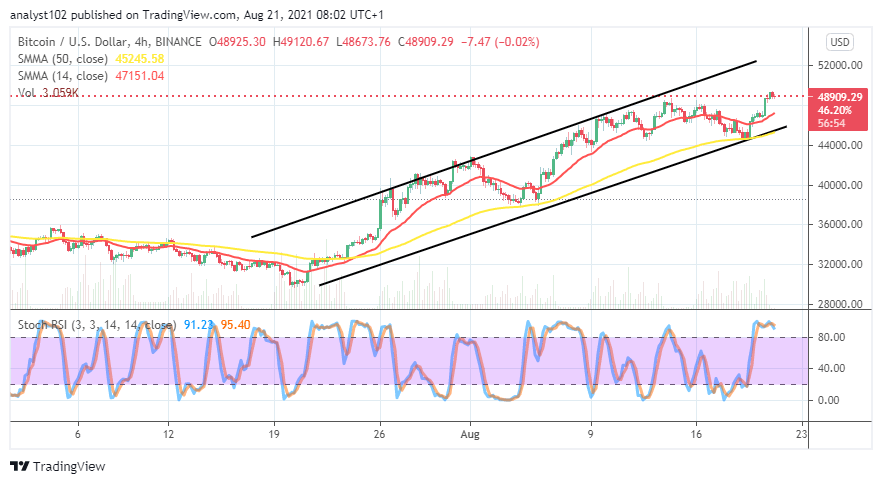
BTC/USD 4-hour Chart
It is now established on the BTC/USD 4-hour chart that the crypto market operation averages $50,000 level is closer to briefly surpass some of past recent higher points ever witnessed in the bullish channel trend-lines. The 50-day SMA trend-line is alongside the lower bullish channel trend-line as the 14-day SMA trend-line is above it within the bullish channel trend lines. The Stochastic Oscillators are in the overbought region with conjoined lines, trying to move in a consolidation manner. It suggests that price tends to move in a less-active format to determine the next direction. The formation of a full-body bearish candlestick closely below or around the point earlier mentioned will lead the market journey back into a downward trading situation. But, it may not last long to deviate from the bullish trend afterward.
Looking to buy or trade Bitcoin (BTC) now? Invest at eToro!
75% of retail investor accounts lose money when trading CFDs with this provide


