Looking ahead, there are many ways the rest of the current cycle can play out moving forward. The following are two scenarios we are expecting to play out as long as the technical and on-chain data continue to show strength.
Our price targets are heavily time-based, condition-based, and blend multiple forms of analysis. Assuming bitcoin price reaches major technical targets to the upside and on-chain metrics are flashing significant sell signals, the probability of a bull market top will increase significantly.
If major technical targets to the upside are tested, and on-chain metrics show little to no signs of significant selling pressure – BTC can easily push higher.
As always – the following is not financial advice and the sole opinion of the writer. Please refer to the full disclaimer at the bottom of this page.
Base Case: $96k by December 2021
We believe BTC can reach $96k by December 2021 in our base case scenario. BTC will only have to double at current prices (~$48k as of writing these lines), which we believe is reasonable considering the deep supply exhaustion BTC is in.
To reach this level of $96k, BTC must first push above the major resistance zone between $51.1-58k.
During this retest of major resistance, it is crucial to monitor on-chain metrics and especially verify that long-term holders and entities holding large amounts of illiquid supply are not selling.
If no on-chain sell signals are flashing, this will likely pave the way for a retest of the current all-time high (~$65k) recorded in April 2021. The chart below shows a rough estimate of one of many paths BTC could take to reach our base case target of $96k.
Technical and on-chain resistance above $58k is not as heavy as the $56-58k area. Given that new large buyers continue to enter the market and shorts continue to get liquidated, breaking above the previous all-time high will not require much effort.
Once BTC closes above the current ATH level ($64.8k), we can expect an accelerated move to the upside as bitcoin price enters the price discovery phase. The latter stands for the levels where an asset was never trading before; hence, there are no previous resistance levels.
Using the 4-year cycle and BTC halving data, Bitcoin has historically reached its bull markets’ top late in Q4 of the year following the halving.
This indicates a blow-off top could occur sometime in December 2021 if BTC continues to follow this pattern. The longer than anticipated consolidation between $30k to $40k gives Bitcoin less time to form structure higher. We have to keep in mind, parabolic phases in BTC result in significant gains in a very short amount of time.
Another reason why we can expect significantly higher prices later this year is the Elliott Wave structure forming since late 2018. Bitcoin appears to have completed wave 3 to the upside, topping at $64.8k, with a complex wave 4 correction, bottoming at $28.8k. With the recent August rally higher, it appears Bitcoin is starting the final fifth bullish wave, possibly pushing bitcoin price significantly above previous all-time highs.
In this scenario, between the April-2021 all-time highs to our base case target of $96k, we expect whales to slowly distribute BTC to retails who are chasing the rally. The more we see on-chain distribution, the more likely BTC will come closer to a macro top.
The crypto community has discussed the probability of the bull market cycle extending into early Q1 or Q2, 2022. This must be taken into consideration and can be seen as a bullish catalyst. If the bull market extends into early 2022, this actually increases our base case target from $96k to the next confluent levels between $110k to $115k.
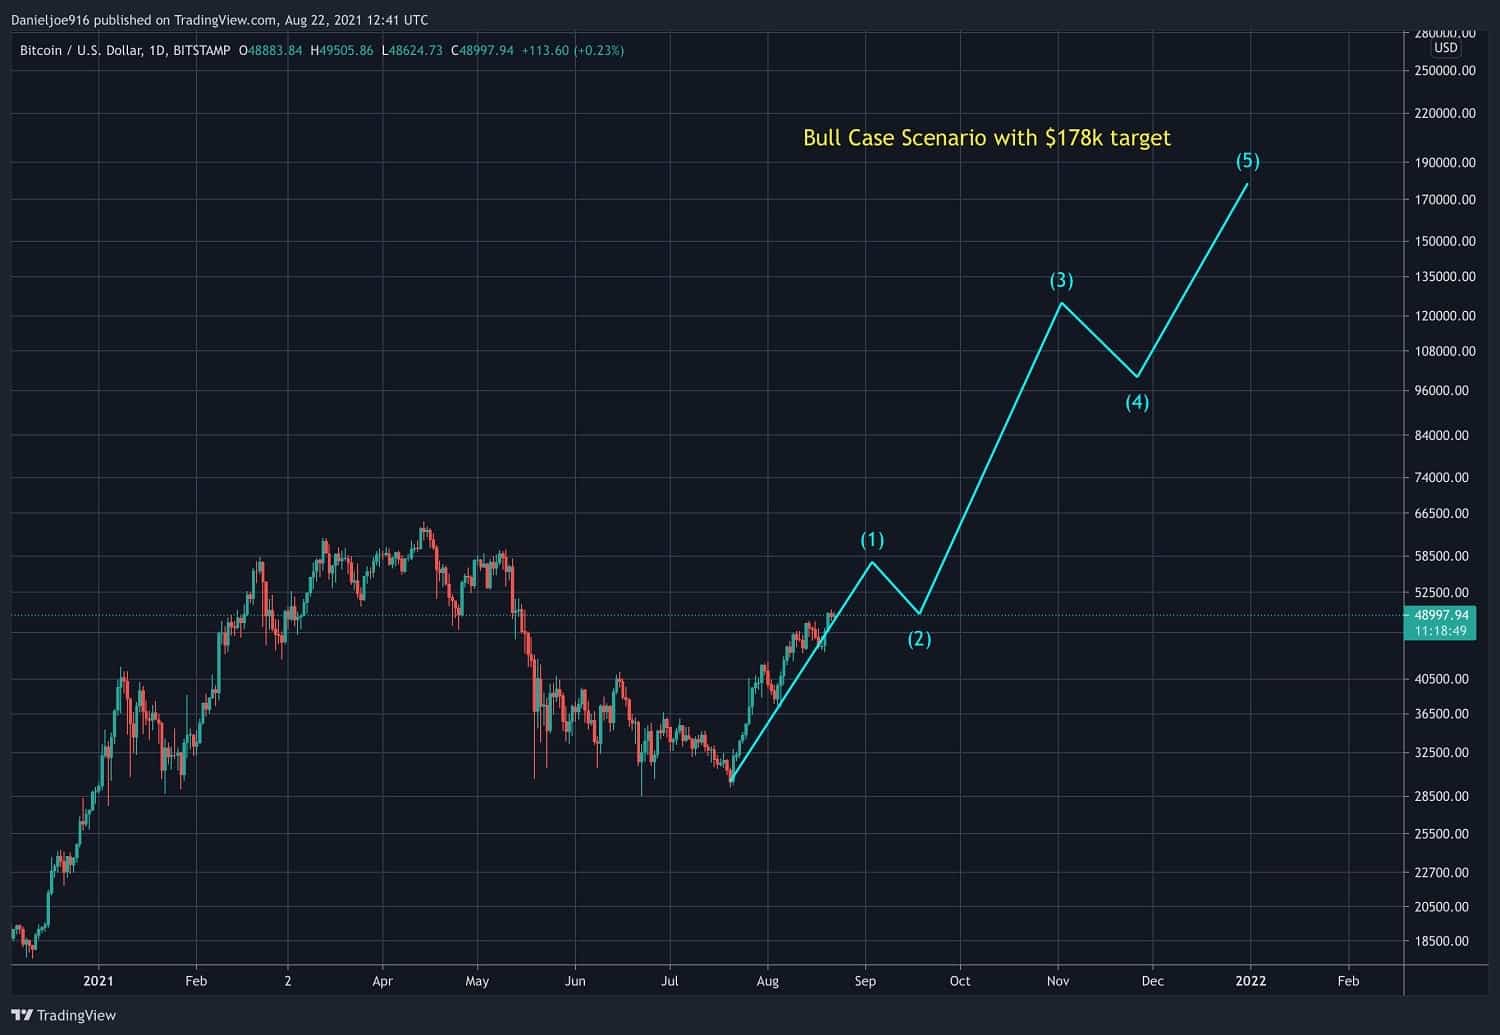
$178k BTC: The Bullish Case
We believe BTC can reach our bullish scenario target of $178k by December 2021 or a bit later, in case the cycle extends into 2022.
This will require minimal on-chain selling pressure, especially as bitcoin price pushes above $100k. As long as the long-term holders continue to hold, even with BTC at $100k, we can easily expect prices to move higher.
This scenario is dependent on the constant supply exhaustion, where the majority of BTC remains illiquid. The chart below is a rough estimate of the possible path Bitcoin could take to reach the bullish target. The following is just one of many ways this can play out:

Our technical targets to the upside found high levels of confluence around $178k to $190k. This also matches various other technical-based models, making this an area of interest for the 2021’s bull market top.
In this scenario, we can expect Bitcoin whales and entities holding large amounts of illiquid supply to start rapidly distributing. Price action at this stage will likely have gone parabolic, with $10K candles printed frequently. At these prices, valuation on-chain metrics such as the MVRV could be reaching previous cycle peaks depending on the activity on the Bitcoin network.
While these 6-figure targets may seem intimidating, they are less than a 4x increase from current levels.
To emphasize this, the scenarios are time-based and condition-based. It strongly depends on a variety of on-chain metrics flashing warning signals, especially when the bitcoin price reaches highly confluent technical targets to the upside.
At the time of this writing, BTC is currently aiming to validate a major technical buy signal which flashed last week to transition from a mid-cycle pullback into a bull market continuation.
Ideally, the $51.1-58k resistance zone must be taken out with a solid push to retest all-time highs at $64.8k. The next few weeks of price action are critical in determining the base case or bull case scenario.


