Bitcoin Price Prediction – August 29
The Bitcoin price prediction continues to follow the sideways movement as the price may soon touch the resistance level of $50,000.
BTC/USD Long-term Trend: Ranging (Daily Chart)
Key levels:
Resistance Levels: $52,000, $54,000, $56,000
Support Levels: $45,500, $43,500, $41,500
BTC/USD is likely to experience another unexpected selloff if the market price remains below the 9-day moving average. Today, the Bitcoin price drops sharply to touch the support of $47,801 after touching the daily high of $49,667. Therefore, a reversal may quickly play out if the king coin trades above the moving averages, and this may send BTC/USD above the opening price of $48,942 level.
Bitcoin Price Prediction: Bitcoin Price Gets Ready for The Upside
At the moment, the technical indicator Relative Strength Index (14) reveals that the Bitcoin price is consolidating around 60-level and any further movement below this level could lead the first digital asset to cross below the 21-day moving average. However, the technical indicator RSI (14) may follow the upside as the signal line could make a quick turn towards 70-level.
On the upside, recovery may not come easy but any attempt to cross above the upper boundary of the channel may halt the bearish scenario and allow for an extended recovery towards the resistance levels of $52,000, $54,000, and $56,000 respectively. However, an increase in selling pressure could force the Bitcoin price to follow a painful path towards the support levels of $45,500, $43,500, and $41,500.
BTC/USD Medium-Term Trend: Ranging (4H Chart)
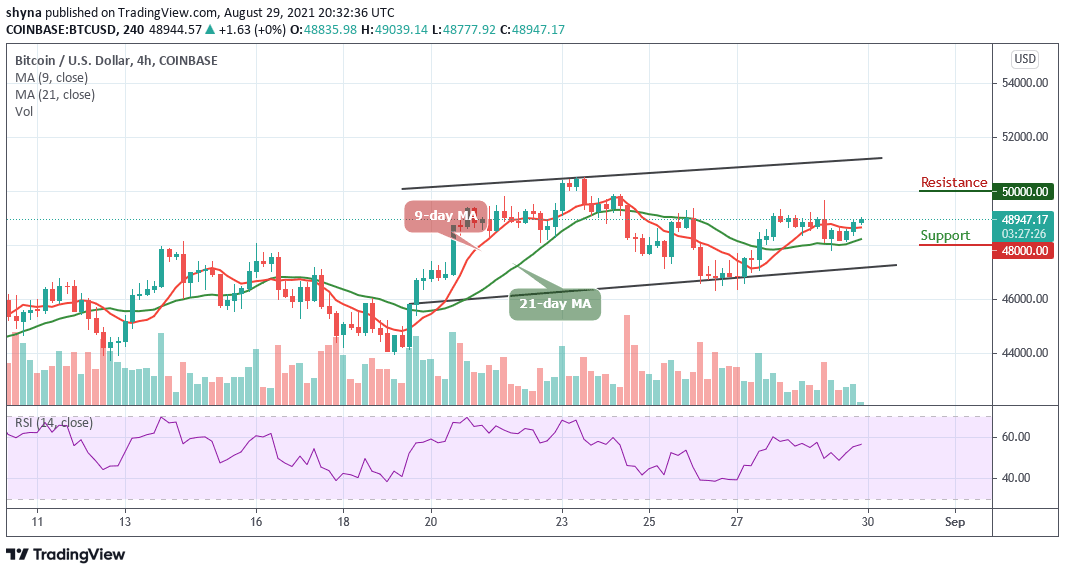
Looking at the 4-hour chart, the Bitcoin price is seen hovering above the 9-day and 21-day moving averages. The chart reveals that the coin survives the $47,500 support as the market prepares for more uptrend by staying above the moving averages. More so, BTC/USD is likely to follow the bull movement if the 9-day MA remains above the 21-day MA. Therefore, higher resistance could be located at $50,000 and above.
Moreover, if the price drops below the 9-day and 21-day moving averages, even $48,500 may not be able to hold the support as the technical indicator Relative Strength Index (14) prepares to cross above 60-level. Meanwhile, the king coin is likely to visit the $48,000 and below if the price breaks toward the lower boundary of the channel.
Looking to buy or trade Bitcoin (BTC) now? Invest at eToro!
75% of retail investor accounts lose money when trading CFDs with this provider


