Ethereum Analysis
Ethereum’s price is battling to break the $4k level despite many of the other ‘alt coins’ climbing and some continuing onward to new all-time highs. ETH closed Monday’s daily candle worth $3,927 and -.59%.
While ETH pumped over the summer when many projects sputtered and failed to recover quickly from the spring downtrend, ETH bullishly retraced to the upside – so a brief reprieve from trending upward only shouldn’t be a shocker to traders.
With Ether’s price doing a stutter-step over the last few weeks, what’s next for the world’s second largest crypto project by market capitalization?
The below chart from Solldy is a solid analysis of Ether’s 1hr chart. This trader posits that ETH is currently using the $3,8k level as support resistance. It will be integral for bears to crack that price level to the downside if they hope to have any short-term success in coming days.

Above $4k Ether bulls are in complete control and only have one true obstacle left in the way at $4,2k before testing ETH’s all-time high of $4,352.
If bullish Ether traders can get the price above the current all-time high then much higher prices are probable and may be forthcoming.
Another analysis worth checking is from DU09 which shows the 1W chart and again emphasizes how weak the resistance is in the low $4k level on Ether. If this level is taken by bulls and the all-time high is breached again to the upside, the next overhead target is the 461.8 fibonacci extensions which corresponds with a $10k Ether price.

Ether’s 24 hour price range is $3,875-$3,967 and the 7 day price range is $3,219-$3,972. ETH’s 52 week price range is $320-$4,352.
Ether closed the weekly candle on Sunday September 5th in green figures for a third straight week.
Solana Price Analysis
Solana reset over the weekend after making an all-time high of $150 that was broken on Monday. SOL’s trend to run and reset before then running again is intact as the asset climbed to multiple news highs on Monday before closing +15.61% and valued at $164.19.
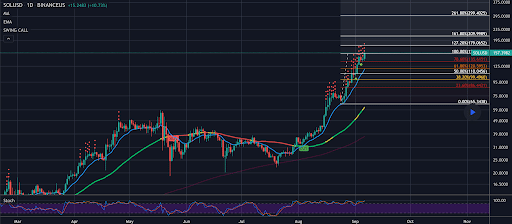
So, where’s Solana heading now that it’s exceeded and has back-tested the 100% Fibonacci extension level of the measured move?

The above chart from CryptocurrencyMagnet shows Solana’s now flipped the $155 level to support resistance and is seeking the next overhead target of $180 on the 1D chart.
If bulls send the price past the $180 level which is the 127.20 extension fib level then the price could be heading for the 161.8 level that corresponds with $210. If bullish traders take the psychological resistance of $200 and then the 127.20 fibonacci level then they’re entirely in control of Solana’s price.
Solana bears will want to get the price back beneath the 100% fibonacci level that corresponds with $155 if they have any chance in the interim. If bearish traders can win that level and push the price lower the next support resistance for bulls is at the 78.6 fibonacci level [$135].
Solana experienced follow-through bullish price action from the onset of Tuesday’s daily candle and made another new all-time high of $174.10 during the day’s first 4hr candle.
SOL’s 24 price range is $139.14-$174.10 and the 7 day price range is $107.52-$174.10. Solana’s 52 week price range is $21.46-$174.10.
SOL’s average price for the last 30 days is $83.45.
Monday’s daily candle closed in green figures and was Solana’s 2nd straight. SOL also closed the weekly candle on Sunday in green figures for an 8th straight week.
The post Ethereum and Solana Price Analysis and Trends appeared first on The Cryptonomist.


