Bitcoin managed to complete a daily close above the previous all-time high at $64.8K at $66K. This is an early bullish signal, but it’s not enough to fully confirm the breakout.
For this to happen, we need to see multiple daily closes, as well as weekly ones above $64.8K. This would provide confirmation and further validation. In the near term, we can expect to see multiple retests of $64.8K as a support level.
Near-Term Caution for the BTC Price
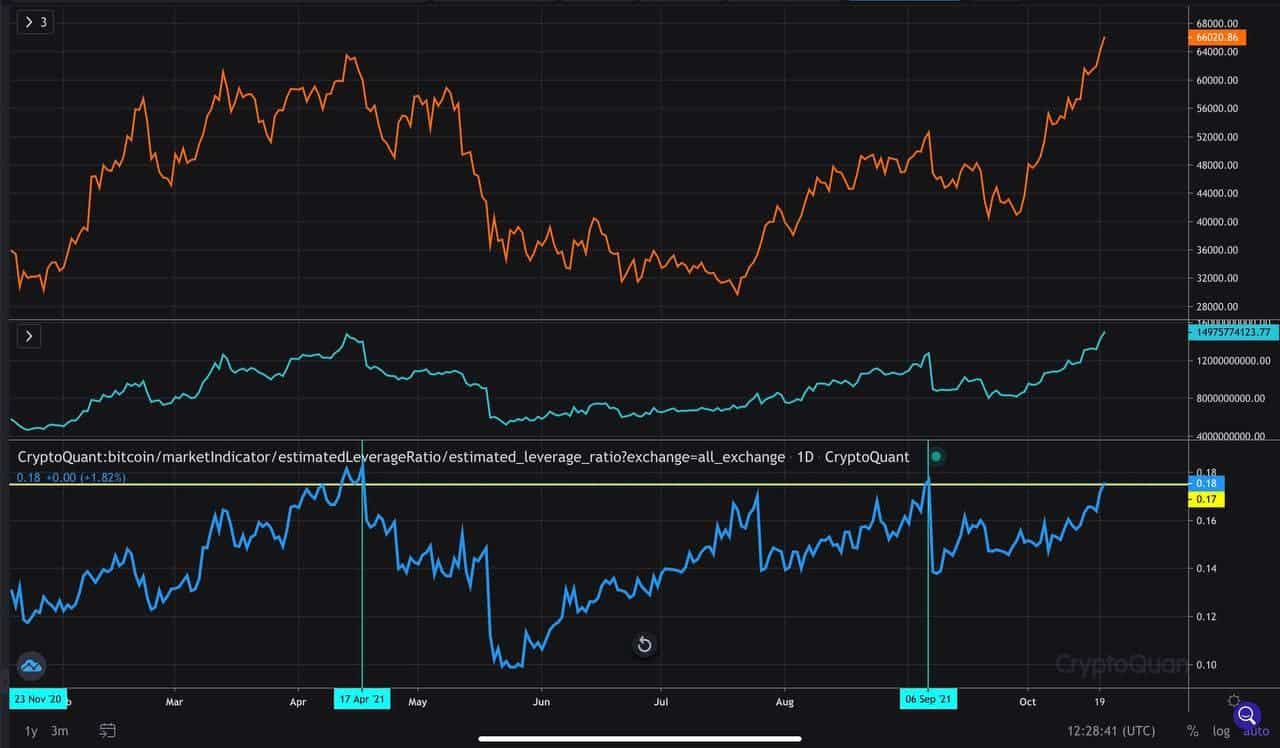
Even though the price closed above the previous all-time high, as mentioned above – it might be too early to celebrate. The open interest has been soaring lately, while the funding rates shot up considerably as well on Binance. The estimated leverage ratio is back to the highs of April and September at 0.18.

The funding rate is not as high as it was in March and April, but the elevated open interest and the estimated leverage ratio do call for near-term caution.
The important support levels to consider in case of a short-term pullback include $64.8K, $63K, $61.8K, $61.3K, and $60K. Below this, stronger support lies at $59.6K, $58.3K, $57.5K, $57.2K, and down at $53K in case of a larger liquidation event.
The 21-day EMA currently rests at $57.5K – an important level to watch. In case BTC continues its upward trajectory, $69.2K and $71.8K are the targets to consider.
What Do Bitcoin On-Chain Indicators Say?
The spot reserves have been trending lower since BTC made a new ATH, which is a positive signal. They are currently at 1.150 million BTC – a multi-year low.
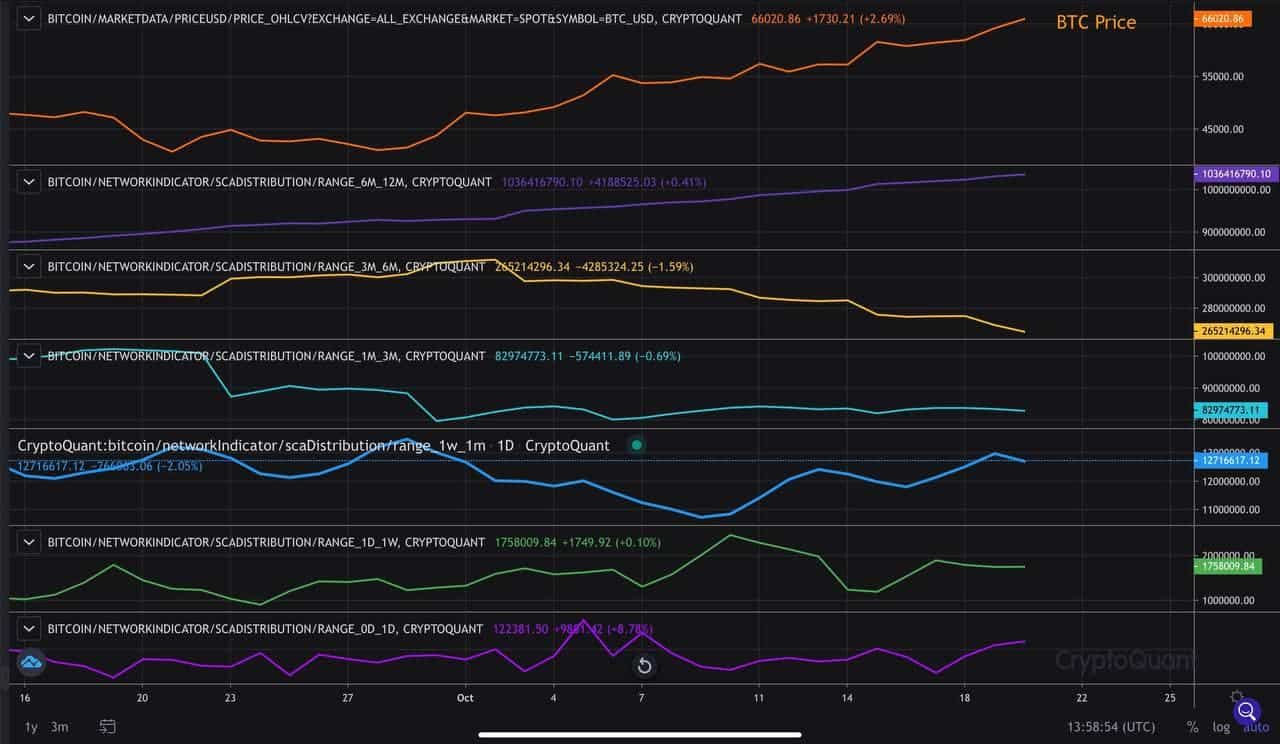
There’s a light distribution from older coin cohorts, but there’s no trend of serious distribution yet. Some younger coins are taking profit. This is a positive signal, given that we just saw the price making a new all-time high.

Back in 2013, we saw a trend of some distribution forming before BTC pushed above the first peak. Then, this trend continued as the price was increasing. In 2017, we didn’t see any distribution until the ATH was painted.
The Mean Coin Age metric fell slightly but still remains near the all-time high. It’s important to watch this indicator carefully to see if there’s a trend of distribution forming. It needs to make multiple consecutive days trending lower – with lower highs and lower lows, to deduce that there’s a trend forming.
In Conclusion
Despite all the hype, it’s important to remain cautious in the near term. The reasons for this are the increasing open interest, the elevated funding rates, and the high estimated leverage ratio. Yet, the mid-to-long-term outlook for Bitcoin remains decisively bullish.
It’s too early to confirm the breakout, but the bullish backtest that took place hours ago is an early positive signal. We will need to see a firm weekly close above $64.8K as the first step toward more upside.
Meanwhile, the dollar remains below a key resistance at 94.47, with the trend of money flowing out of long-term bonds getting steam. This indicates that money is rotating back into stocks and potentially into BTC as well.


