Bitcoin drops to new level
Wednesday saw follow through selling across the aggregate crypto market and that selling was set in motion by bitcoin bulls losing the $60k level as support resistance.
BTC closed Wednesday’s daily candle -$1,837. Even with this recent pullback bitcoin has a $1.10 trillion market capitalization, at the time of writing.
So, what can be made of the data that the market is providing traders and where is BTC’s price going next?
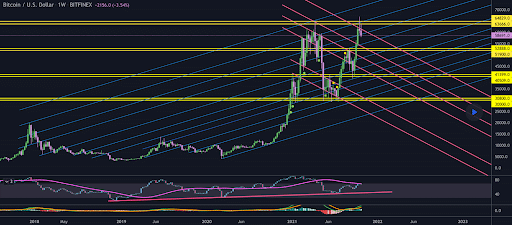
Traders will now be looking at different timescales to garner a better understanding of what’s happening in the short-term with BTC’s price. The BTC/USD 1W chart below from parissap shows all of the weekly supports and resistances on that timescale.
Bulls have minimal support at $58,5k but heavier support resistance between $51,9k-$52,888. If bulls lose that level then the next stops are the $40,509-$41,399 level and $30k-$30,8k level.
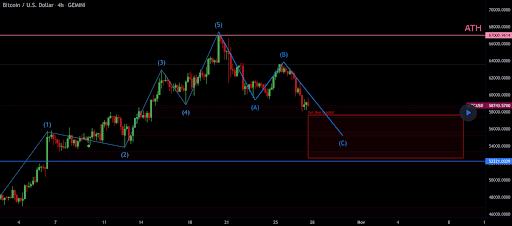
A 100% Fibonacci Retracement of the developing Head & Shoulders pattern that was mentioned in yesterday’s article on BTC’s 4hr chart takes its price back to the $52k-$53k level.
The BTC/USD 4hr chart below from Ronin90q20v is a good interpretation of the head & shoulders patterns potential implications. It shows where the pattern completion zone could be if BTC’s historical price action looking left on the chart isn’t strong enough to hold the $58,4k level on this timescale.
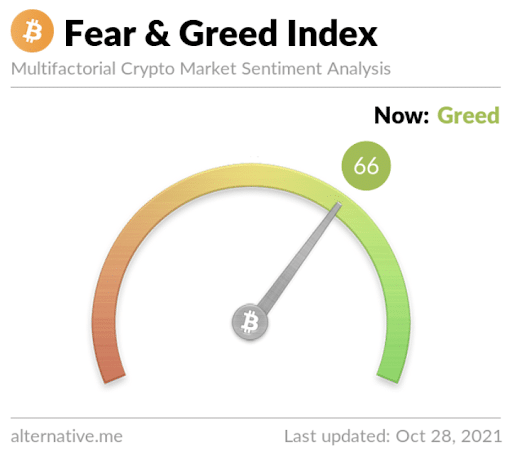
The Fear and Greed Index is 66 Greed and reading -7 points from yesterday’s measurement of 73 Greed.
BTC’s 24 hour price range is $55,178-$61,796 and its 7 day price range is $58,641-$67,276. Bitcoin’s 52 week price range is $13,151-$67,276.
Bitcoin’s price on this date last year was $14,101.
The average BTC price for the last 30 days is $55,934.
Bitcoin [-3.05%] closed Wednesday’s daily candle worth $58,453 and in red figures for a second consecutive day.
Ethereum below $4K
Ether’s price straddled the $4k level as support resistance on Wednesday before inevitably closing below that level and losing the daily battle to Ether bears. Just three days ago Ether made its highest daily candle close ever – so, what’s next for Ether market participants?
The ETH/USD 1D chart below from AlanSantana shows Ether’s strongest support resistances. Traders will be monitoring these levels closely to determine if ETH will follow bitcoin lower given the macro sentiment continues to be negative.
Those support resistance levels are the 0.382 fibonacci level [$3,716.05], 0.5 [$3,512.5], 0.618 [$3,308.95], and the 0.786 fib level [$3,019.15].
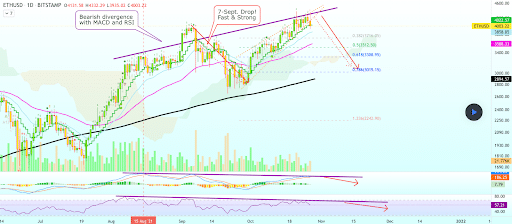
If Ether bulls want to keep this multi-year rally going, they’ll need to reclaim $4k and then press the gas to reach new highs. If those new highs are indeed reached, a close above the $4,5k-$4,6k level on the daily could be enough to shift momentum back to ETH bulls.
ETH’s 24 hour price range is $3,941-$4,304 and its 7 day price range is $3,943-$4,310. Ether’s 52 week price range is $380.83-$4,361.
Ether’s price on this date last year was $415.93.
The average ETH price for the last 30 days is $3,665.
Ether [-5.04%] closed Wednesday’s daily candle worth $3,921 and closed again in red figures for a second straight day.
Chainlink price sold-off
Chainlink’s price sold-off with the vast majority of the market on Wednesday and is looking to hold some key levels now to maintain the progress it’s made recently on it’s uptrend.
LINK’s price is holding better than the majority of the altcoin market, at the time of writing.
The below LINK / USD 4hr chart below from iHeartData shows Chainlink with plenty of room to retrace back down to its demand line at $25.5 before breaking out to the downside of its longtime rising channel.
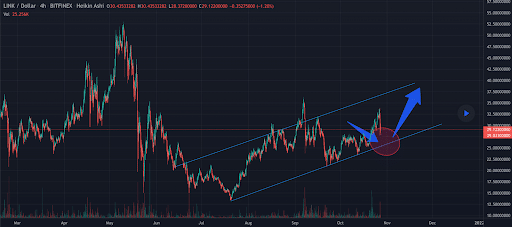
Traders can see above that LINK’s 4hr channel’s demand line has been respected multiple times with at least six touches dating back multi-months.
If LINK can somehow finish the week above the $30 level, there will be no technical damage down to the asset on the weekly timescale.
LINK’s 24 hour price range is $28.64-$33.98 and its 7 day price range is $27.41-$33.98. Chainlink’s 52 day price range is $9.02-$52.7.
The average Chainlink price for the last 30 days is $27.07.
LINK [-11.3%] closed Wednesday’s daily candle worth $28.85 and in red digits after the two prior daily candles closed in green digits.
The post Sales across the crypto market: Bitcoin loses the $60k level appeared first on The Cryptonomist.


