This week the market took a downturn which resulted in most cryptocurrencies suffering significant losses. We take a look at Ethereum, Cardano, Ripple, Binance Coin, and Solana.
Ethereum
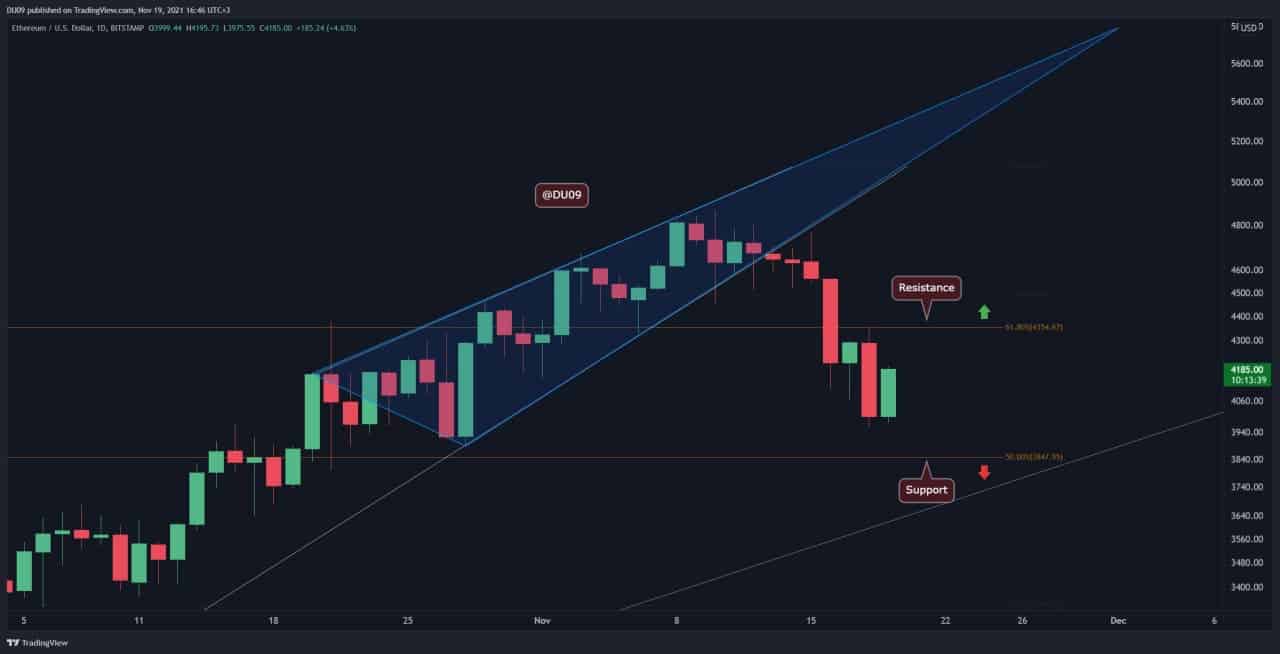
Ethereum broke below the ascending wedge this week and corrected all the way to $3,958.
Compared to last week, ETH registered a -11.3% correction and fell under $4,000 for the first time in November. The first sign that such a correction could take place was given by the daily MACD that did a bearish cross just before the downtrend started.
The current price action signals that the correction may come to an end soon, as the downwards momentum is decreasing. Moreover, the RSI on the 4-hour timeframe has formed a bullish divergence as the ETH price fell under $4,000. This signals to the bulls that this is their opportunity to return and attempt a reversal. To recover from the recent drop, ETH has to overcome the key resistance levels found at $4,354.
Looking ahead, ETH has good support, just under $4,000, and that level is a very attractive entry for bulls and buyers. Therefore it should see a good defense against further drops. Despite this drop, ETH remains bullish on larger timeframes, which can be interpreted as a normal retrace in a bullish market.

Cardano
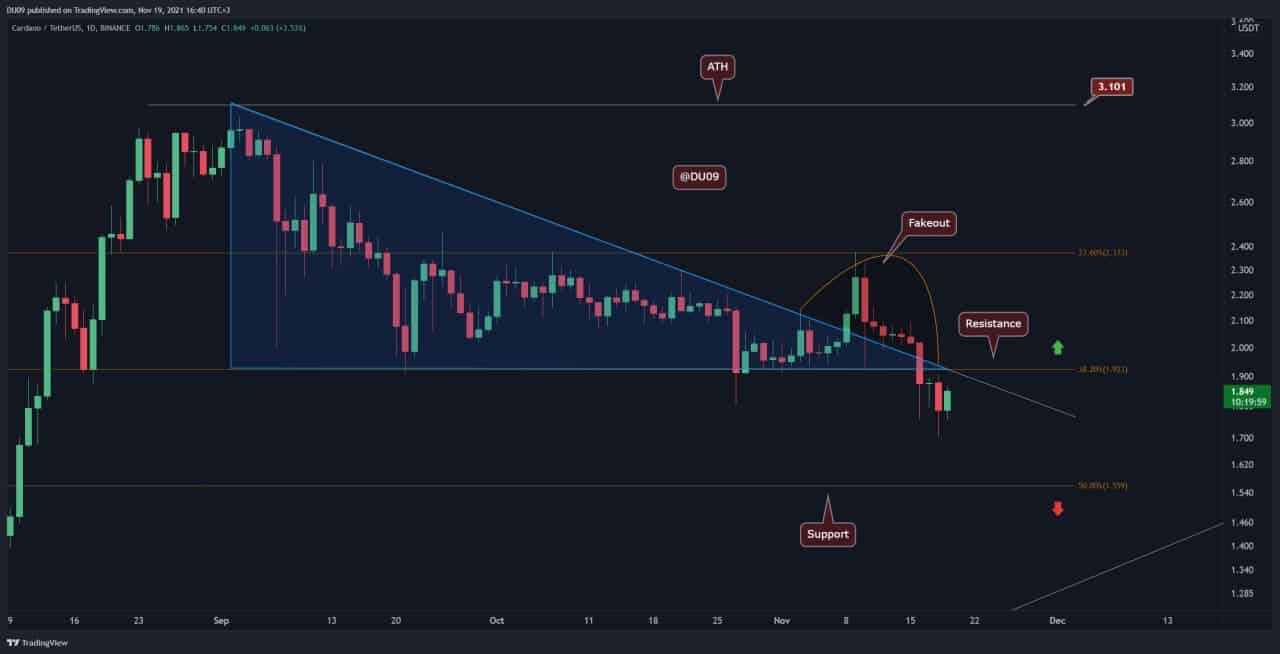
ADA’s attempt to go above $2.4 was sharply rejected last week, and since then, the price has continued to make lower lows reaching $1.7 during yesterday’s correction. For this reason, ADA’s performance was poor in the last seven days, with a -10.3% drop.
The breakout from the descending triangle can be interpreted as a fakeout which may have trapped many bulls that hoped for a rally instead. The current resistance for ADA sits at $1.9, which was the former base of the descending triangle, while support is found at $1.7 and $1.5.
Looking ahead, ADA may have an opportunity to stop the bearish trend as the RSI has made a bullish divergence on the 4-hour timeframe, similar to Ethereum. However, one has to be very careful as daily MACD continues to remain bearish. To confirm the bullish divergence, ADA has to return back above $1.9.

Ripple
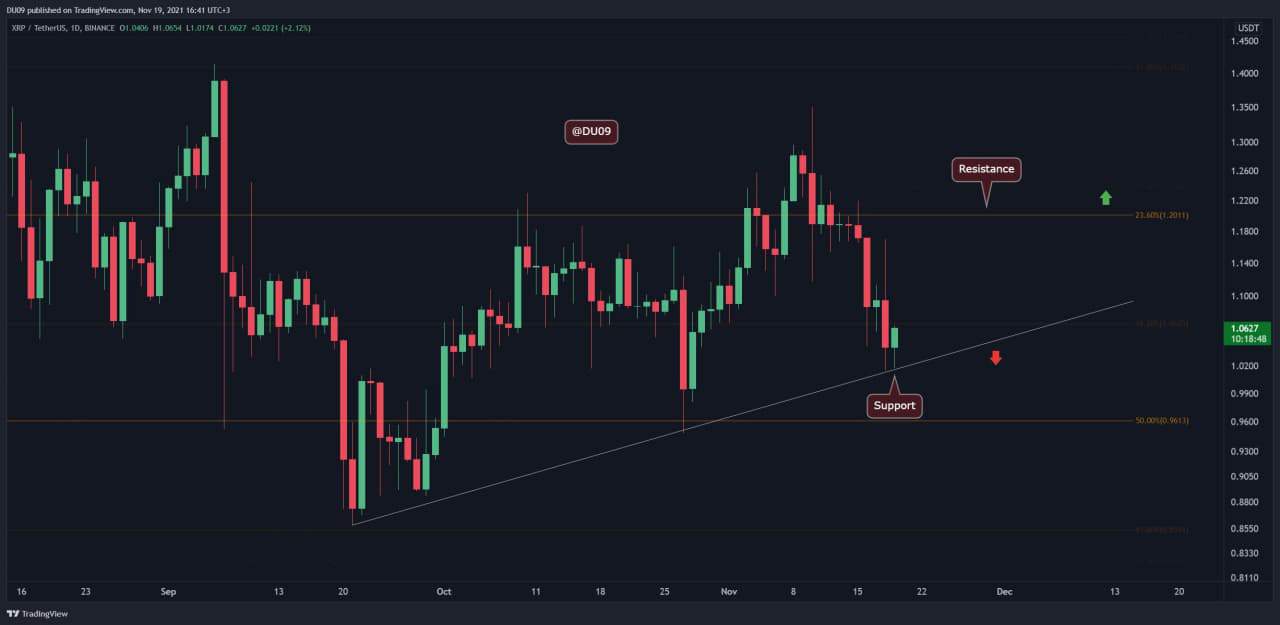
This past week, XRP broke below the $1.2 support level and continued to fall all the way to $1. As such, XRP had a disappointing performance with a 12.5% drop.
The question now is if XRP can maintain its price above $1. So long as the bulls maintain this key support level, the macrostructure will remain bullish for XRP and this last price drop can be interpreted as a higher low.
Looking ahead, volume and MACD continue to be on the bearish side, while RSI is giving some hopes of a reversal similar to ADA and ETH. If XRP bulls can stop prices from further losses, then XRP has a good chance to recover in the coming week.

Binance Coin
Last week, BNB had a strong rally which was stopped in its tracks before reaching the all-time high at $692. This week, bears took control of the price and pushed it all the way down to the support at $516. For this reason, BNB’s price fell 10% over the past seven days.
The current resistance for BNB is found at $600. Since touching the support level yesterday, the cryptocurrency is back on the uptrend, but the resistance at $600 will be the real test for bulls. If BNB is successful in breaking this key resistance, then the rally can continue for a new attempt at reaching the all-time high.
Looking ahead, the indicators for BNB give mixed signals, with a bearish daily MACD and an RSI that is trying to curve back up. The fight at the $600 resistance is likely to decide the winner in the coming week.

Solana
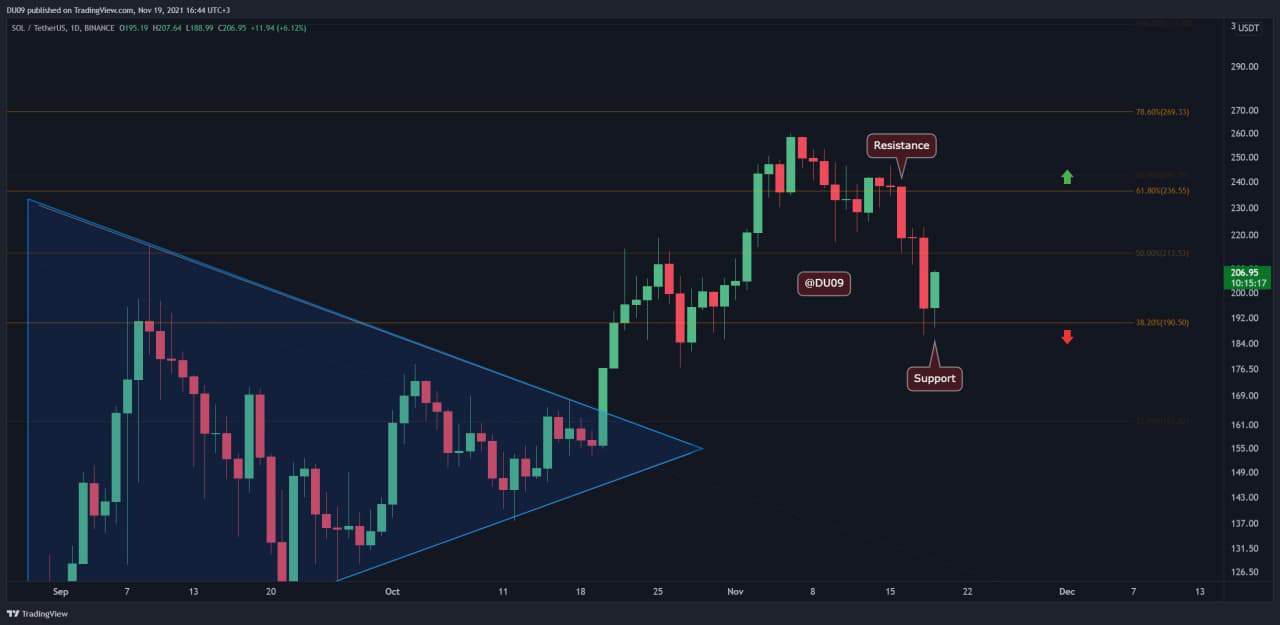
SOL did not have a good week and declined by more than 11%. It also broke below the support at $216, which was the previous all-time high from September. SOL found support on the $190 level and is currently trying to reverse the downtrend.
Unfortunately, the daily MACD continues to accelerate downwards and has been bearish for over a week without any signs of a reversal on the horizon. The support at $190 appears strong. However, it is early to say if the downtrend will end here, and it is best to be cautious.
Looking ahead, Solana already had a stellar performance this year, and it is hard to demand more from it at this time. Therefore, this correction can last a while, particularly because on the daily timeframe, SOL has made a large bearish divergence between the top in September and the one in November.


