The Liveliness on-chain metric tracks accumulation and distribution behavior of bitcoin holders, corresponding to price.
The below is from a recent edition of the Deep Dive, Bitcoin Magazine’s premium markets newsletter. To be among the first to receive these insights and other on-chain bitcoin market analysis straight to your inbox, subscribe now.
Today, we’re revisiting a useful on-chain metric, Liveliness, that tracks the accumulation and distribution behavior of HODLers. As a refresher, Liveliness is calculated as a ratio: the sum of all Coin Days Destroyed and the sum of all coin days ever created.
- Liveliness increases as long-term holders distribute more coins, creating more coin days destroyed relative to coin days created.
- Liveliness decreases as long-term holders accumulate more coins, creating less coin days destroyed relative to coin days created.
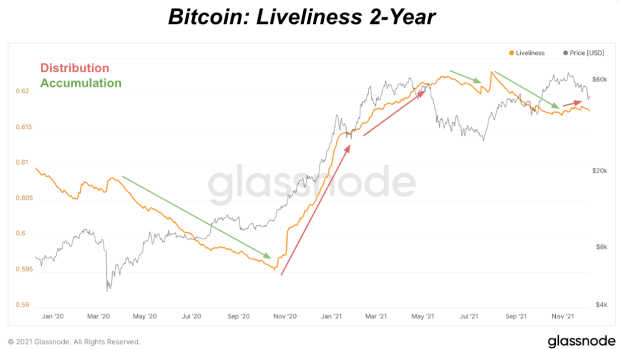
Throughout bitcoin’s history, we see clear patterns of long-term holder distribution and accumulation that drive bull and bear market cycles that can be easily tracked with Liveliness.
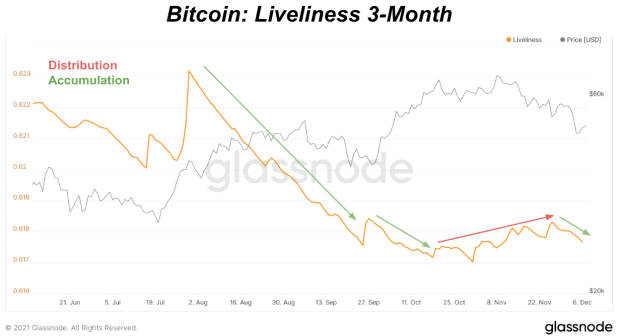
Over the last year, we saw a rising Liveliness metric with long-term holders distributing more coins during the previous all-time high price rise from January through May. After that came a strong period of accumulation during lower prices, up until October where some long-term holder distribution started to take shape. Over the last couple weeks with price potentially reaching a bottom after the recent deleveraging event, the Liveliness trend looks to have started a shift back towards a period of slight accumulation.

This would be a good sign to see long-term holders accumulate at these lower prices before another period of distribution. Accelerated long-term holder distribution at the current bitcoin price would signal a lack of confidence from the “smart money” that bitcoin has more upside over the next few months.

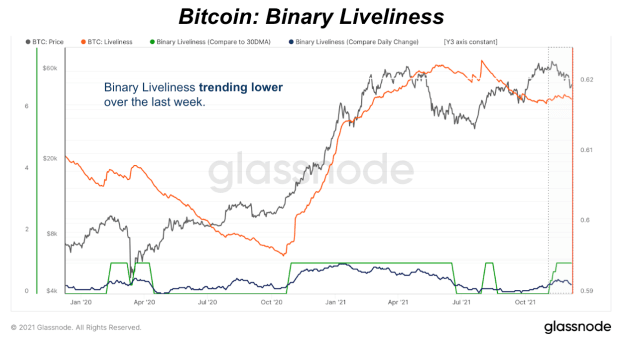
Another way to view the Liveliness trend is to look at Binary Liveliness. Binary Liveliness is designed to help identify periods of accumulation and high distribution by older coins. The green value on the below chart will produce 1 when Liveliness is higher than its 30-day moving average. When it’s below the average, it produces 0.
The blue line will return a 1 when Liveliness is higher today than the previous day or else it produces 0. A 30-day moving average is then applied to these results.
What the current data shows, looking at the blue line, is that Binary Liveliness is starting to trend and sustain lower values which signals Liveliness is in a potential new downtrend, or a period of more long-term holder accumulation.


