Bitcoin Price Prediction – December 12
The Bitcoin price prediction is on the brink of breaking above $50,000 following a momentous rally yesterday that has seen it rise to $49,700.
BTC/USD Long-term Trend: Bearish (Daily Chart)
Key levels:
Resistance Levels: $54,000, $56,000, $58,000
Support Levels: $45,000, $43,000, $41,000
According to the daily chart, BTC/USD touches $49,721 as all-time high beckons. The first digital asset is seen trading around the 9-day moving average. The Bitcoin price is now within touching distance of forming a new all-time high above the opening price at $49,424.
Bitcoin Price Prediction: Bitcoin (BTC) May Range-bound before Moving Up
The Bitcoin price has been able to clearly break above $49,000 and reach a price per coin of $49,721. The main question is whether it will be able to hit the resistance level of $50,000 where it may usually find large resistance. Therefore, traders may likely wait for a continuation of the bull trend which could help the first digital asset reach new highs.
Moreover, for Bitcoin to would have reached $49,700, this could be the beginning of a new bull run in the crypto space. Meanwhile, as the technical indicator Relative Strength Index (14) is likely to cross above 40-level and the Bitcoin price may soon hit the potential resistance levels at $54,000, $56,000, and $58,000 while sliding below the lower boundary of the channel could drag the price to the critical support levels of $45,000, $43,000, and $41,000 respectively.
BTC/USD Medium-term Trend: Ranging (4H Chart)
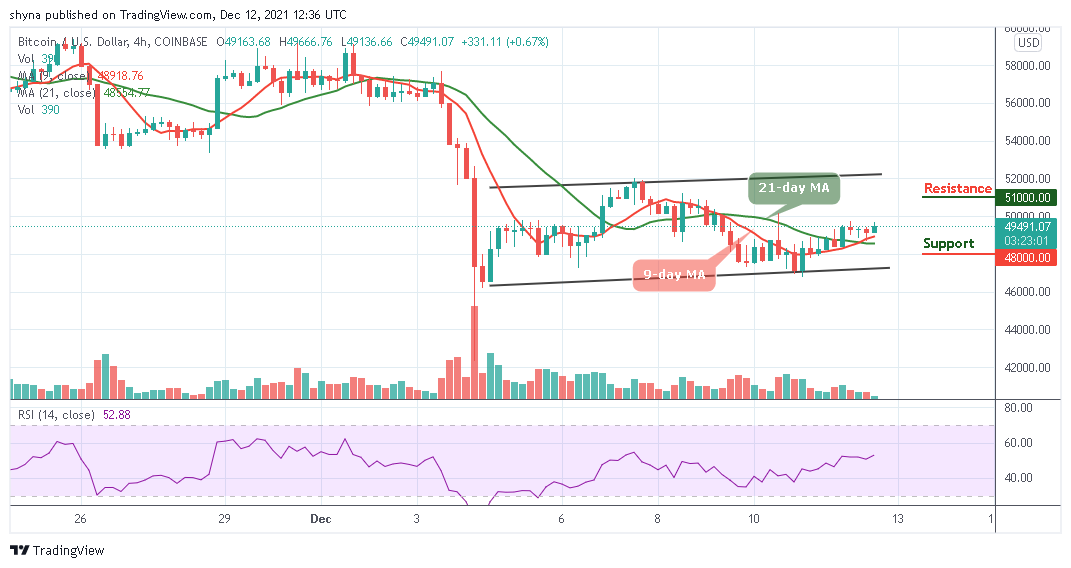
On the 4-hour chart, BTC/USD is currently trading around $49,491 above the 9-day and 21-day moving averages after a reversal from $49,012 where the market started trading today while the Bitcoin price is now moving towards the north as the red-line of the 9-day MA is crossing above the green-line of the 21-day MA.
However, if buyers could strengthen and energize the market, they can further push the price towards the channel which could allow the market price to hit the resistance level of $51,000 and above. Meanwhile, the technical indicator Relative Strength Index (14) is currently moving above 50-level, but any bearish movement below the moving averages may drag the price to the support level of $48,000 and below.
Looking to buy or trade Bitcoin (BTC) now? Invest at eToro!
68% of retail investor accounts lose money when trading CFDs with this provider
Read more:


