Bitcoin Analysis
Bitcoin’s price rallied back above $48k on Tuesday and closed its daily candle +$1,631.
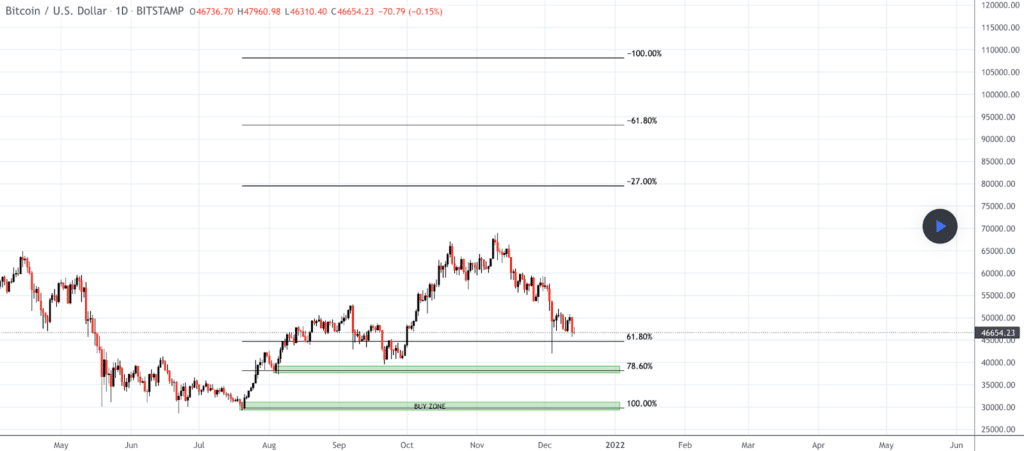
The BTC/USD 1D chart below from winsjglobal shows the most important fibonacci levels to the upside and downside that traders should be watching closely.
Bullish BTC traders are still hoping to hold the 61.8% fib level [$44,723] and reverse course again to the upside. Targets overhead are the -27% fib extension level [$79,334] and the -61.8% fibonacci level [$93,116].
Bearish BTC traders are looking to crack the 61.8% fib level and then push BTC’s price lower to test the 78.6% fib level [$38,302]. If they succeed to then crack the 78.6% level, BTC bears will set their sights on hitting a 100% retracement at the $30k level.

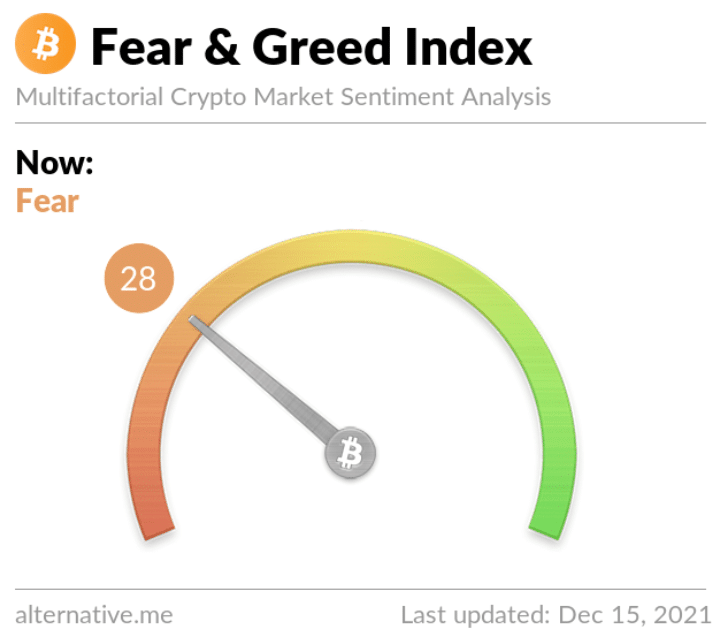
The Fear and Greed Index is 28 Fear and +7 from yesterday’s reading of 21 Extreme Fear.

Bitcoin’s price is trading below all important moving averages: 20-Day MA [$54,182], 50-Day [$58,389], 100-Day MA [$51,900], 200-Day MA [$48,734].
BTC’s 24 hour price range is $46,355-$48,094 and its 7 day price range is $46,355-$50,878. Bitcoin’s 52 week price range is $19,135-$69,044.
The price of bitcoin on this date last year was $19,259.
The average price of BTC for the last 30 days is $54,844.
Bitcoin [+3.49%] closed its daily candle worth $48,408 and in green figures for the third day out of the last four days.
Ethereum Analysis
Ether’s price was outperformed by BTC during Tuesday’s daily candle but finished +$80.28 on the day.
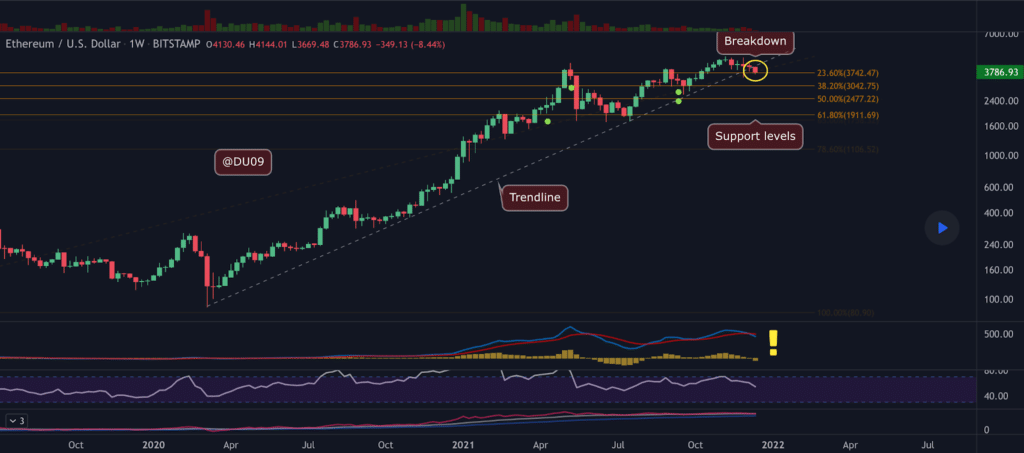
The ETH/USD 1W chart below DU09 indicates that Ether’s price has broken down and where bulls need to find support resistance before an attempt at pivoting to the upside.
Ether bulls are looking to hold the 23.6% fib level [$3,742.47] and climb again to the upside to test an integral level of inflection at $4k.
Bearish ETH traders are looking to break the 23.6% fib level and send ETH’s price back down to test the 38.2% fib level [$3,042.75]. If Ether bears can crack that level then they’ll shift their focus to a 50% retracement at [$2,477.22].

Ethereum’s important moving averages are as follows: 20-Day MA [$4,248], 50-Day MA [$4,188], 100-Day MA [$3,671], 200-Day MA [$3,022].
ETH’s 24 hour price range is $3,710-$3,881 and its 7 day price range is $3,710-$4,458. Ether’s 52 week price range is $575.67-$4,878.
The price of ETH on this date in 2020 was $580.07.
The average price of ETH for the last 30 days is $4,255.
Ether [+2.12%] closed its daily candle on Tuesday worth $3,860.41.
ADA Analysis
Cardano’s price was sent higher by bullish ADA market participants on Tuesday and finished its daily candle on Tuesday +$.122.

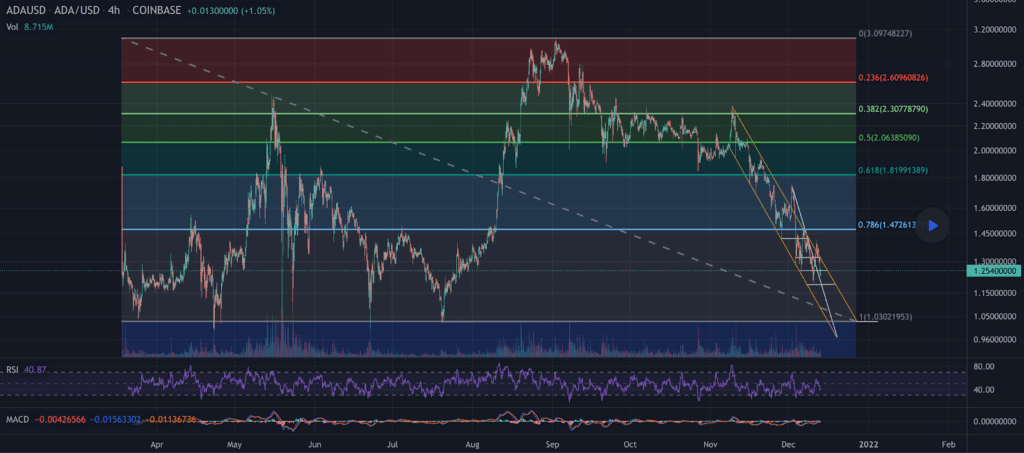
The ADA/USD 4hr chart above from culbert425 shows ADA’s price in between two important fibonacci levels. ADA bulls are looking to hold support at a 100% retracement [$1.03] before an attempt to pivot back to the .786 fib retracement level [$1.47].
If bearish ADA traders have their way they’ll crack $1.03 and send ADA’s price lower which could signal the beginning of a longer downtrend for ADA.
ADA’s important moving averages are as follows: 20-Day MA [$1.55], 50-Day MA [$1.88], 100-Day MA [$2.03], 200-Day MA [$1.70].
Cardano’s 24 hour price range is $1.20-$1.27 and its 7 day price range is $1.20-$1.41. ADA’s 52 week price range is $.127-$3.09.
Cardano’s price on this date last year was $.157.
The average price for ADA over the last 30 days is $1.59.
Cardano [+3.49%] closed its daily candle on Tuesday worth $1.26 and snapped a streak of two straight daily closes in red figures.
The post Bitcoin ($48k), Ethereum ($3.8k), Cardano Price Analyses appeared first on The Cryptonomist.


