Discussing bitcoin’s price cycles and how macroeconomic developments are shaping the market.
Listen To This Episode:
In this episode of Bitcoin Magazine’s “Fed Watch” podcast, Christian Keroles and I sat down with Dylan LeClair to go over on-chain data from his popular Deep Dive newsletter. We also tied it into some macro topics involving bitcoin and central banking. Once again, this was recorded live on the Bitcoin Magazine YouTube channel. If you’d like to watch live, subscribe there and follow us on Twitter to get updates of times we will be on. As we get a hang of live streaming the show, we will be able to answer live questions from the chat for audience interaction.
Diving In, Realized Price Of Bitcoin
After a personal intro from LeClair, we got right into some of the charts from his latest monthly Deep Dive. First up is the realized price of bitcoin.
What is interesting about many of the charts in the Deep Dive is that they are technical analysis done on the fundamentals of the network. This realized price is like a moving average but of on-chain data. In particular, the realized price is the average price of bitcoin when last spent, or in other words, the average cost basis for bitcoin. The slope of the realized price line indicates market cycle timing. When the slope is steep, coins are changing hands rapidly as new entrants come into the market, so it’s a bull market. When the slope is flat, price is in a bear market or accumulation phase.
Aggregated Futures Open Interest
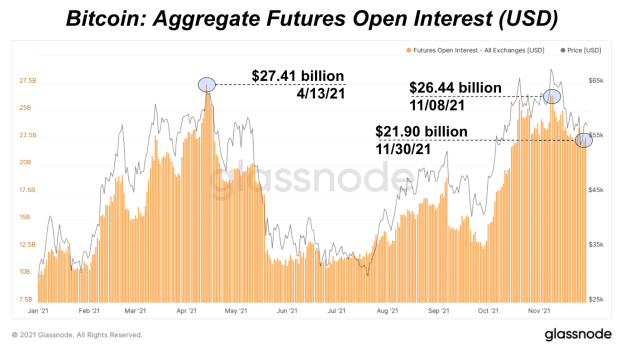
These are the charts that I looked at the longest on this month’s Deep Dive, so I had to ask LeClair about the future open interest specifically.

This chart is dated, being from the November newsletter, but LeClair brought up the live chart from Glassnode and shared his screen. At first glance, open interest appears to simply follow price. However, upon closer examination, I started noticing divergences.
The first one is in July 2021. You see the black price line and the orange open interest lines — the price dips, but the open interest goes up, a divergence. Also, on the live chart LeClair showed us, that same divergence is happening again today. Price has dipped in the last week, but open interest is increasing.
Next Phase For Bitcoin
As our discussion progressed, we started talking about what is next for bitcoin. Many metrics from the Deep Dive are pointing to this not being the end of this market cycle. Keroles and I have gone over why we think market dynamics have changed and perhaps the four-year cycle is dead.
LeClair’s response is that bitcoin is waiting for the next catalyst, whether that is a new round of quantitative easing (QE) or stimulus checks, something is needed to kick off the next leg higher. This brings up a very important conversation that I don’t hear being had anywhere else: Is bitcoin a risk-on asset, and as sound money, will it eventually turn into a risk-off asset? I asked LeClair where we are in that transition.
Macro, Japan Repo, Fed Reverse Repo
At the end of the show, we were coming up on a hard break for the next segment on the live stream. I had a few macro news items to get to, so we sped through those and asked LeClair for his thoughts.
The first item was the Bank of Japan (BoJ) emergency liquidity injection into their repo market. It was the first time since 2006 that the BoJ policy was implemented on the same day it was announced. The issue was that the market repo rate was spiking, signaling that not all was well with the plumbing in the Japanese market. The BoJ stepped in to provide 2 trillion yen (about $18 billion) and repo rates still increased.
My thoughts are that this could be contagion from the Chinese real estate collapse going on just across the water from Japan, which Japanese investors are probably highly involved in.
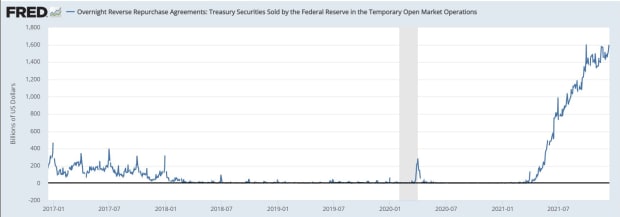
Then we quickly look at the Federal Reserve’s reverse repo total that is spiking once again to new highs at $1.6 trillion. This represents banks, money market funds or primary dealers lending the Fed money and getting U.S. treasuries (USTs) as collateral. It shows a general collateral shortage in the global plumbing and risk avoidance. It is also interesting that this is happening as the Japanese market is facing very similar issues. We’ll keep an eye on it and report more in the future.


