Bitcoin Analysis
Bitcoin’s price traded sideways for the bulk of Wednesday’s daily candle and finished the day marginally in red figures [-$297].
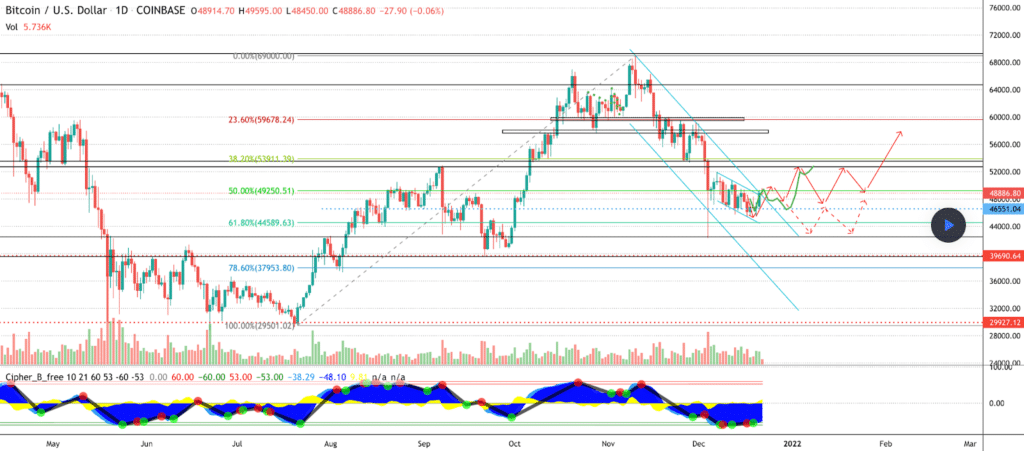
The BTC/USD 1D chart below from gsotolongo shows BTC’s price trying to confirm a breakout and backtest on that time frame.
BTC bulls are still trying to get a candle close above the 50.00% fib level [$49,250.51] and again reclaim the $50k level. If bulls successfully reclaim the $50k level, the next overhead target is the 38.20% fib level [$53,911.39].
From a bearish trader’s perspective, BTC bears need to withstand the current bullish momentum. If bears can withstand it, they’ll again try to test the 61.80% fib level [$44,589.63] and attempt to break that level and follow it with a daily candle close below it to push BTC’s price lower.

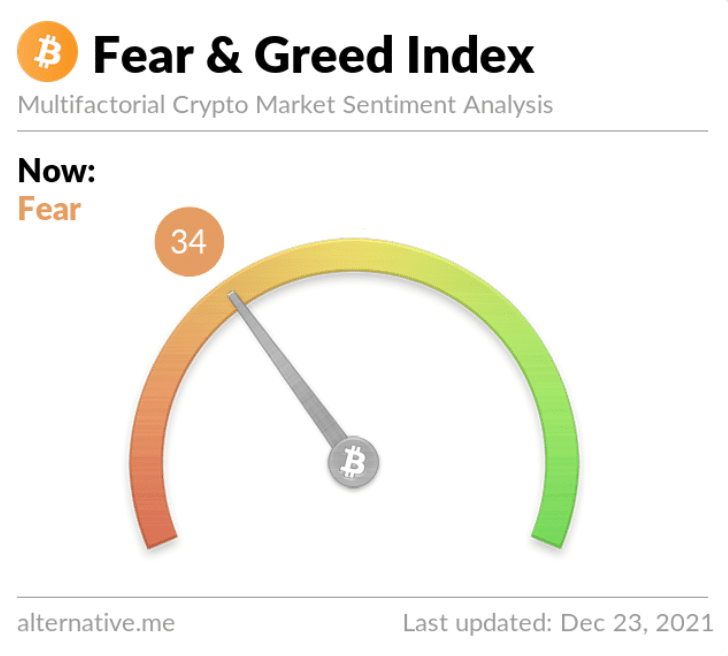
The Fear and Greed Index is 34 Fear and -11 from yesterday’s reading of 45 Fear.

Bitcoin’s moving averages are as follows: 20-Day [$51,381.42], 50-Day [$57,549.44], 100-Day [$52,437.46], 200-Day [$48,478.07], Year to Date [$47,365.8].
BTC’s 24-hour price range is $48,729-$49,876 and its 7-day price range is $45,723-$49,876. Bitcoin’s 52-week price range is $22,860-$69,044.
The price of bitcoin on this date last year was $23,308.
The average price of BTC for the last 30 days is $51,593.
Bitcoin [-0.61%] closed its daily candle worth $48,626 and broke a streak of two straight daily candle closes in green figures.
Ethereum Analysis
Ether’s traders also settled up in red digits on Wednesday, and ETH’s price finished the day -$36.8.
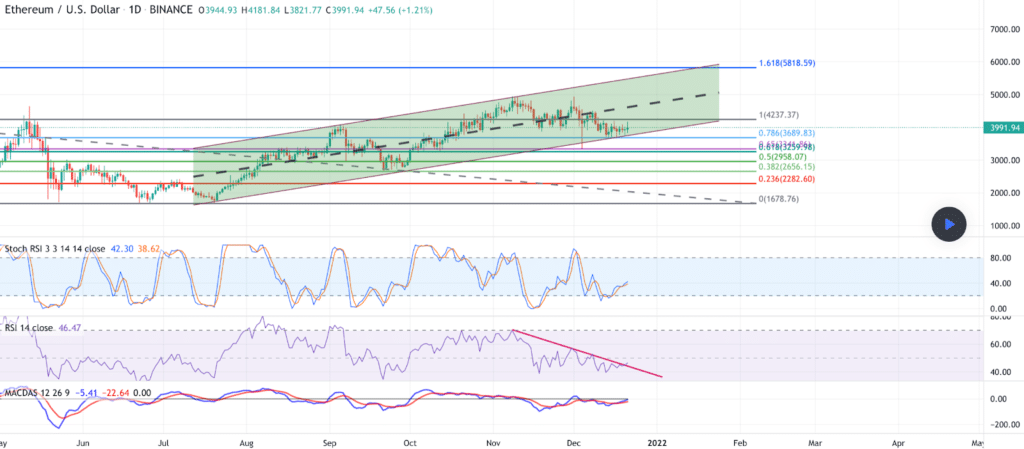
In the ETH/USD 1D chart below, Smart_Cryptologistist indicates that it’s decision time for Ether market participants.
Ether bulls are hoping they can hold a long-term ascending channel and its trendline and send ETH’s price back above an important level of inflection at $4k.
Bullish ETH traders have held the 0.786 fib level [$3,689.83] as support and are now seeking to take back to the 1 fib level [$4,237.37].
If bearish Ether traders succeed instead, they’ll need to test the 0.786 fib again and breach it to the downside before testing the 0.618 [$3,259.98].

Ether’s moving averages are as follows: 20-Day [$4,188.49], 50-Day [$4,244.48], 100-Day [$3,763.47], 200-Day [$3,088.42], Year to Date [$2,750.97].
ETH’s 24-hour price range is $3,995-$4,106, and its 7-day price range is $3,727-$4,106.
Ether’s 52-week price range is $575.67-$4,878.26.
The price of ETH on this date in 2020 was $587.96.
The average price of ETH for the last 30 days is $4,161.51.
Ether [-0.92%] closed its daily candle on Wednesday, valued at $3,979.47.
Solana Analysis
Solana’s price finished -$1.32 on Wednesday and has closed in red figures for three of the last four days.
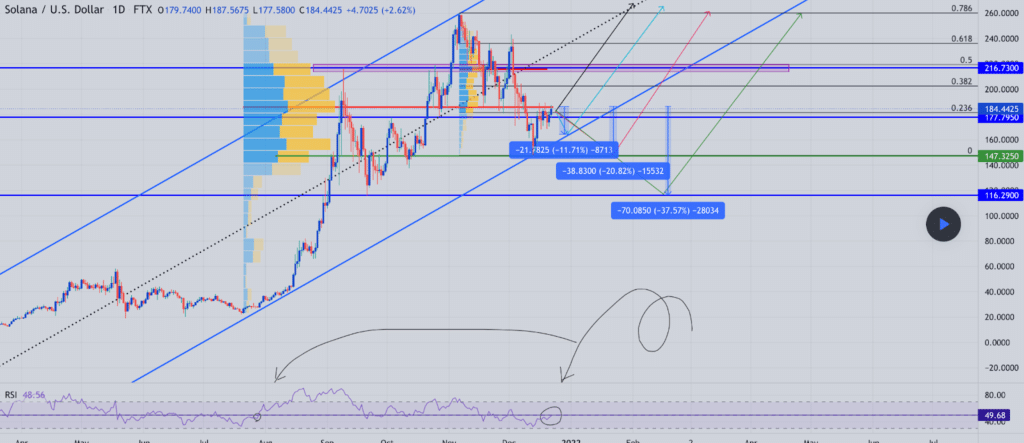
The SOL/USD 1D chart below from aria1382 shows Solana’s price is attempting to crack overhead resistance at the 0.236 fib level [$184.23]. If that level is cracked, then the next level bulls will attempt to reclaim is the 0.382 fib [$202.45].
Solana bears, conversely, are hoping to send SOL’s price again back down to re-test the 0 fib [$147.32] and, if possible, send SOL’s price back down to the $116 level. The $116 level could be the last line of defense for bulls before a trip back down to a two-figure SOL price.

Solana’s moving averages are as follows: 20-Day [$190.71], 50-Day [$201.30], 100-Day [$159.82], 200-Day [$96.18], Year to Date [$77.48].
Solana’s 24-hour price range is $178.02-$187.62, and its 7-day price range is $169.15-$187.89. SOL’s 52-week price range is $1.16-$259.96.
Solana’s price on this date last year was $1.21.
The average price for SOL over the last 30 days is $190.26.
Solana [-0.73%] closed its daily candle on Wednesday, worth $178.37.
The post Bitcoin ($48k), Ethereum ($3.9k), Solana Price Analyses appeared first on The Cryptonomist.


