

Bitcoin Analysis
Bitcoin’s price has been trading in an extremely narrow range over the last five days; in fact, BTC’s price has closed within a $378 window over that span.
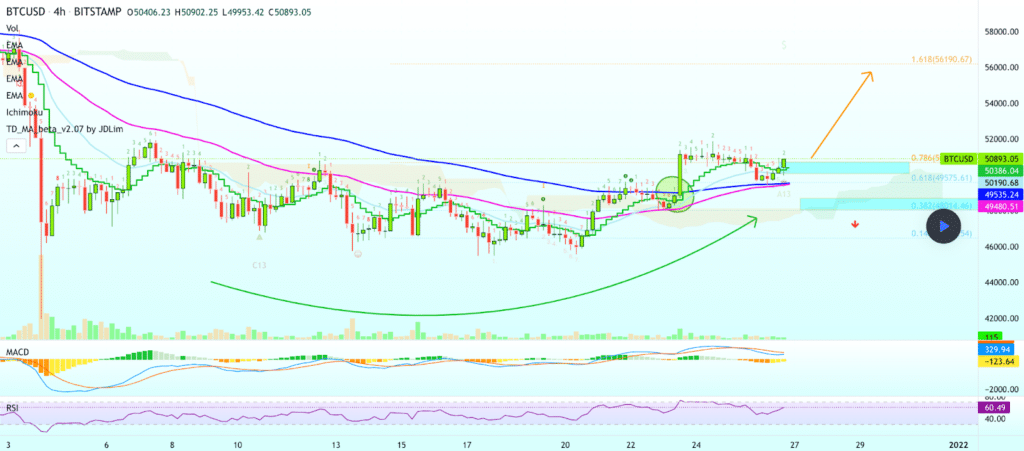
The BTC/USD 4HR chart below from AlanSantana shows BTC bulls trying to now flip the 0.786 fib level [$50,800] to support resistance while also taking aim more than $5,300 higher. That overhead target is the 1.618 fib level [$56,190.67].
Bearish BTC traders are conversely trying to push BTC’s price back below 0.786 and back below $50k at the 0.618 fib level [$49,575.61]. If bears have their way at that level, a secondary target for bearish traders below is the 0.382 fib level [$48,014.46].
The Fear and Greed Index is 41 Fear and +1 from Sunday’s reading of 40 Fear.

The most important BTC Moving Averages are as follows: 20-Day [$50,489.49], 50-Day [$56,990.79], 100-Day [$52,680.81], 200-Day [$48,392.99], Year to Date [$47,409.80].
BTC’s 24-hour price range is $50,546-$52,050 and its 7-day price range is $47,046-$52,050. Bitcoin’s 52-week price range is $25,923-$69,044.
The price of bitcoin on this date last year was $27,125.
The average price of BTC for the last 30 days is $50,466.
Bitcoin [-0.22%] closed its daily candle worth $50,684 and in red figures to close the week after finishing Saturday in green figures.
Ethereum Analysis
Ether’s price closed Sunday’s daily candle -$24.93, but ETH’s price still finished above an important level of inflection at $4k.
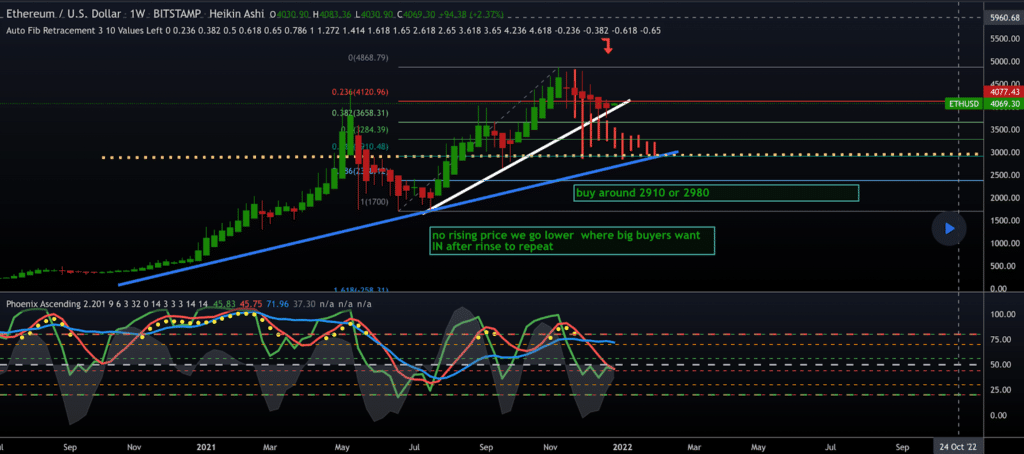
An important chart for Ether market participants currently is the ETH/USD 1W chart, and there’s an interpretation of this timescale below from Skookum_.
Traders will note that ETH’s price is currently ranging between the 0.382 fib level [$3,658.31] and the 0.236 fib level [$4,120.96]. Above the 0.236 fib level, bulls are setting their sights on 0 [$4,868.79].
From a bearish trader’s perspective, ETH bears want to snap the 0.382 fib [$3,658.31] and test lower prices at the 0.50 fib [$3,284.39].
Ether’s most important moving averages are: 20-Day [$4,151.54], 50-Day [$4,262.61], 100-Day [$3,798.45], 200-Day [$3,123.52], Year to Date [$2,766.66].
ETH’s 24-hour price range is $4,041-$4,129, and its 7-day price range is $3,934-$4,157. Ether’s 52-week price range is $713.72-$4,878.
The price of ETH on this date in 2020 was $732.96.
The average price of ETH for the last 30 days is $4,128.
Ether [-0.61%] closed its daily candle on Sunday worth $4,036.24 and in red figures for a second straight day.
Chainlink Analysis
LINK’s price finished Sunday’s daily candle +$.02, and bullish LINK traders have seized some momentum back from bearish traders over the last week.
The LINK/USD 1D chart below from EdgarTigranyan allows traders to visualize the most important levels for Chainlink traders between the $20-$30 range.
Bullish LINK traders are trying to hold the 38.20% fib level [$22.79] and then reclaim the 50.00% fib level [$25.74]. If bulls are successful at that level, they’ve got a secondary target of the 61.80% fib level [$28.7] and a third target at the 65.00% fib level [$29.50].
The targets below for bearish LINK traders begin firstly with breaking the 38.20% fib level with a secondary target of the 23.60% fib level [$19.17]. The third target below for LINK bears is 0.00% [$13.23] and a full retracement from LINK’s breakout – this level will only be achieved if bears are able to break a long-term trendline to the downside.

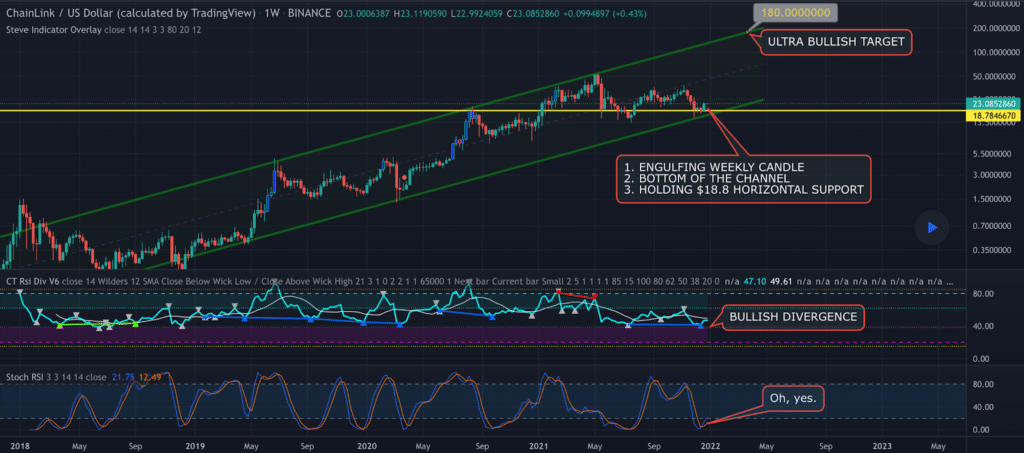
Another LINK chart for traders to consider is the LINK/USD 1W chart from Crypto_Burger. The chart shows LINK’s price respecting a long-term trendline that’s part of an ongoing ascending channel that dates back to 2018.
LINK’s price is trading below all important moving averages except for the 20-Day, at the time of writing: 20-Day [$21.08], 50-Day [$26.37], 100-Day [$26.47], 200-Day [$27.27], Year to Date [$26.73].
Chainlink’s 24-hour price range is $22.93-$24.42, and its 7-day price range is $18.48-$24.42. LINK’s 52-week price range is $11.05-$52.7.
LINK’s price on this date last year was $12.67.
The average price of Chainlink over the last 30 days is $21.14.
LINK [+0.09%] closed its daily candle on Sunday worth $22.99 and in green figures for a third consecutive daily close.
The post Bitcoin ($50k), Ethereum ($4k), Chainlink Price Analyses appeared first on The Cryptonomist.


