Bitcoin Price Prediction – December 29
The Bitcoin price prediction gains 0.55% as bulls trying to push the coin above the 9-day and 21-day moving averages.
BTC/USD Long-term Trend: Bearish (Daily Chart)
Key levels:
Resistance Levels: $52,000, $54,000, $56,000
Support Levels: $44,000, $42,000, $40,000
BTCUSD – Daily Chart
BTC/USD is currently trading at the resistance level of $47,805. The market price is now below the 9-day and 21-day moving averages, indicating sideways movement within the market. Yesterday, after several attempts to break above the upper boundary of the channel, the Bitcoin price fell below the moving averages; the buyers expect the coin to regain back the loses and move towards the resistance level of $50,000.
Bitcoin Price Prediction: Bitcoin (BTC) May Consolidate Before the Uptrend
After a successful break below $48,000 level, the Bitcoin price needs to extend its recovery above the 9-day and 21-day moving averages. However, the next key resistance is near $49,000, above which the price might test $50,000. Meanwhile, on the downside, the $46,000 level could be a decent support to keep the Bitcoin price below the moving averages. However, the main breakdown support may be forming near the $47,500 level.
Moreover, the Bitcoin price begins a bullish movement towards the resistance level of $49,000 while the technical indicator Relative Strength Index (14) is considering a stay above 40-level. Looking at the market movement, there is likely that king coin may experience a quick retracement and traders may see the resistance levels of $52,000, $54,000, and $56,000. On the downside, the Bitcoin price could fall towards the lower boundary of the channel to hit the support at $45,000, if that support fails to hold the sell-off, BTC/USD could see a further decline towards the support levels of $44,000, $42,000, and $40,000.
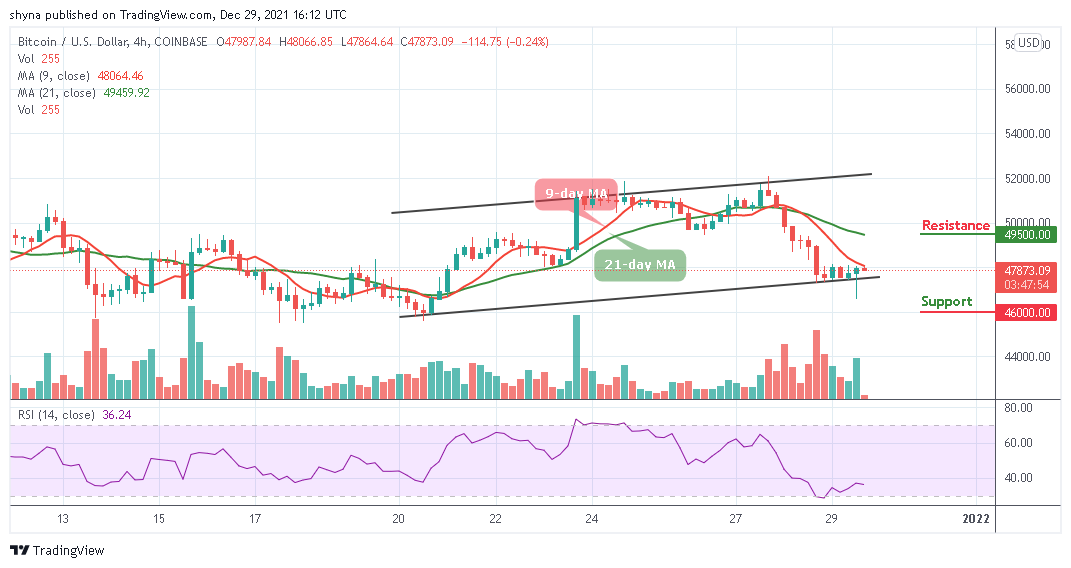
BTC/USD Medium – Term Trend: Ranging (4H Chart)
On the 4-hour chart, the Bitcoin price is sliding below the 9-day and 21-day moving averages. However, traders expect the coin to gain more momentum and push the coin above the 9-day moving average. On the contrary, if the selling pressure continues, it can bring the coin below the lower boundary of the channel, the $46,000 and below may come into play.
Moreover, if the buyers push the price to the upside, traders may expect a strong bullish movement that could hit the resistance at $49,500 and above. Meanwhile, the technical indicator Relative Strength Index (14) is still below 40-level, suggesting a bearish signal into the market.
Looking to buy or trade Bitcoin (BTC) now? Invest at eToro!
68% of retail investor accounts lose money when trading CFDs with this provider
Read more:


