Amidst another red weekend, Bitcoin is facing its most critical support area in the mid-term. So far, despite 2022’s first day, the new year has recorded seven consecutive daily red candles (keeping in mind there are a few more hours until today’s candle close).
Option Market Analysis
By @N_E_D_A
The sharp spike in omicron cases, US Federal Reserve’s announcement about raising interest rates due to a surge in the inflation rate, along with the events in Kazakhstan – are probably the fundamental reasons behind the recent selling pressure in the crypto markets.
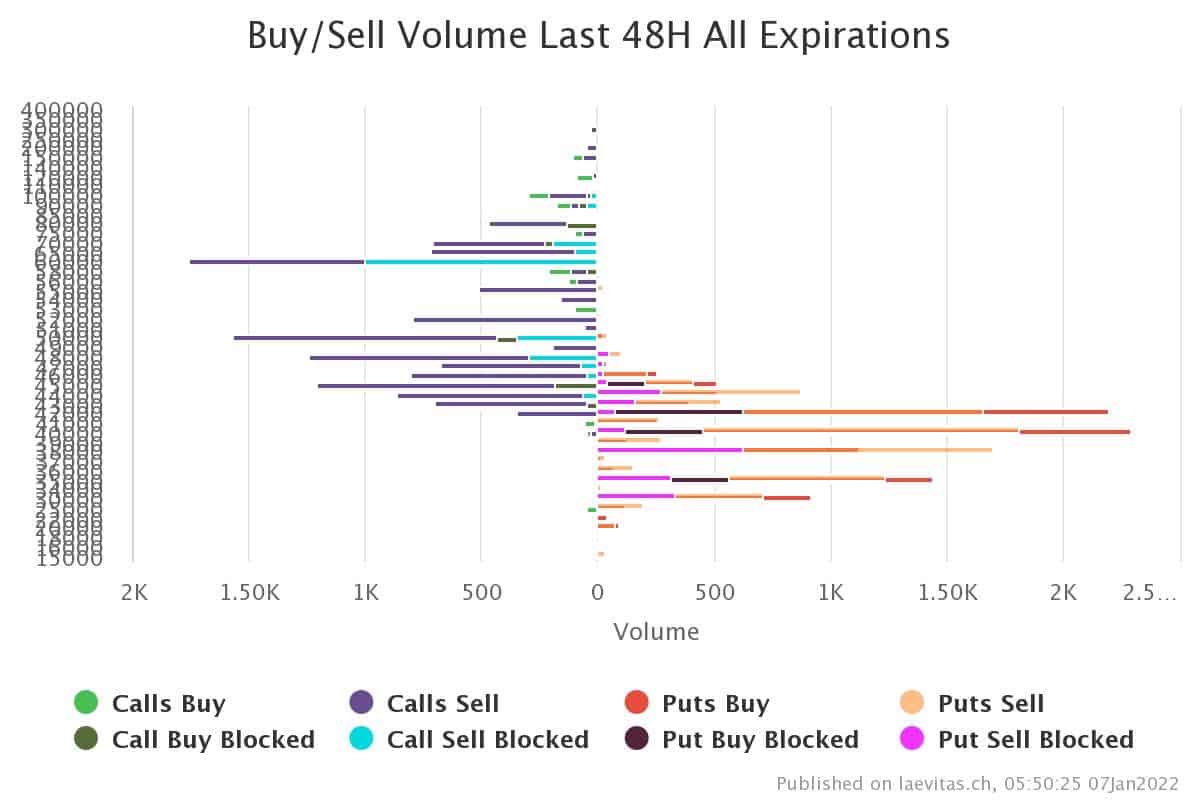
Fear is also all around in the options market. Options traders have been hedging their portfolios by selling Calls and buying Puts during the last few days. Last 48-hours Top Instruments open interest change tells on hedging strategies for short-dated expiries.
Technical Analysis
By @GrizzlyBTCLover
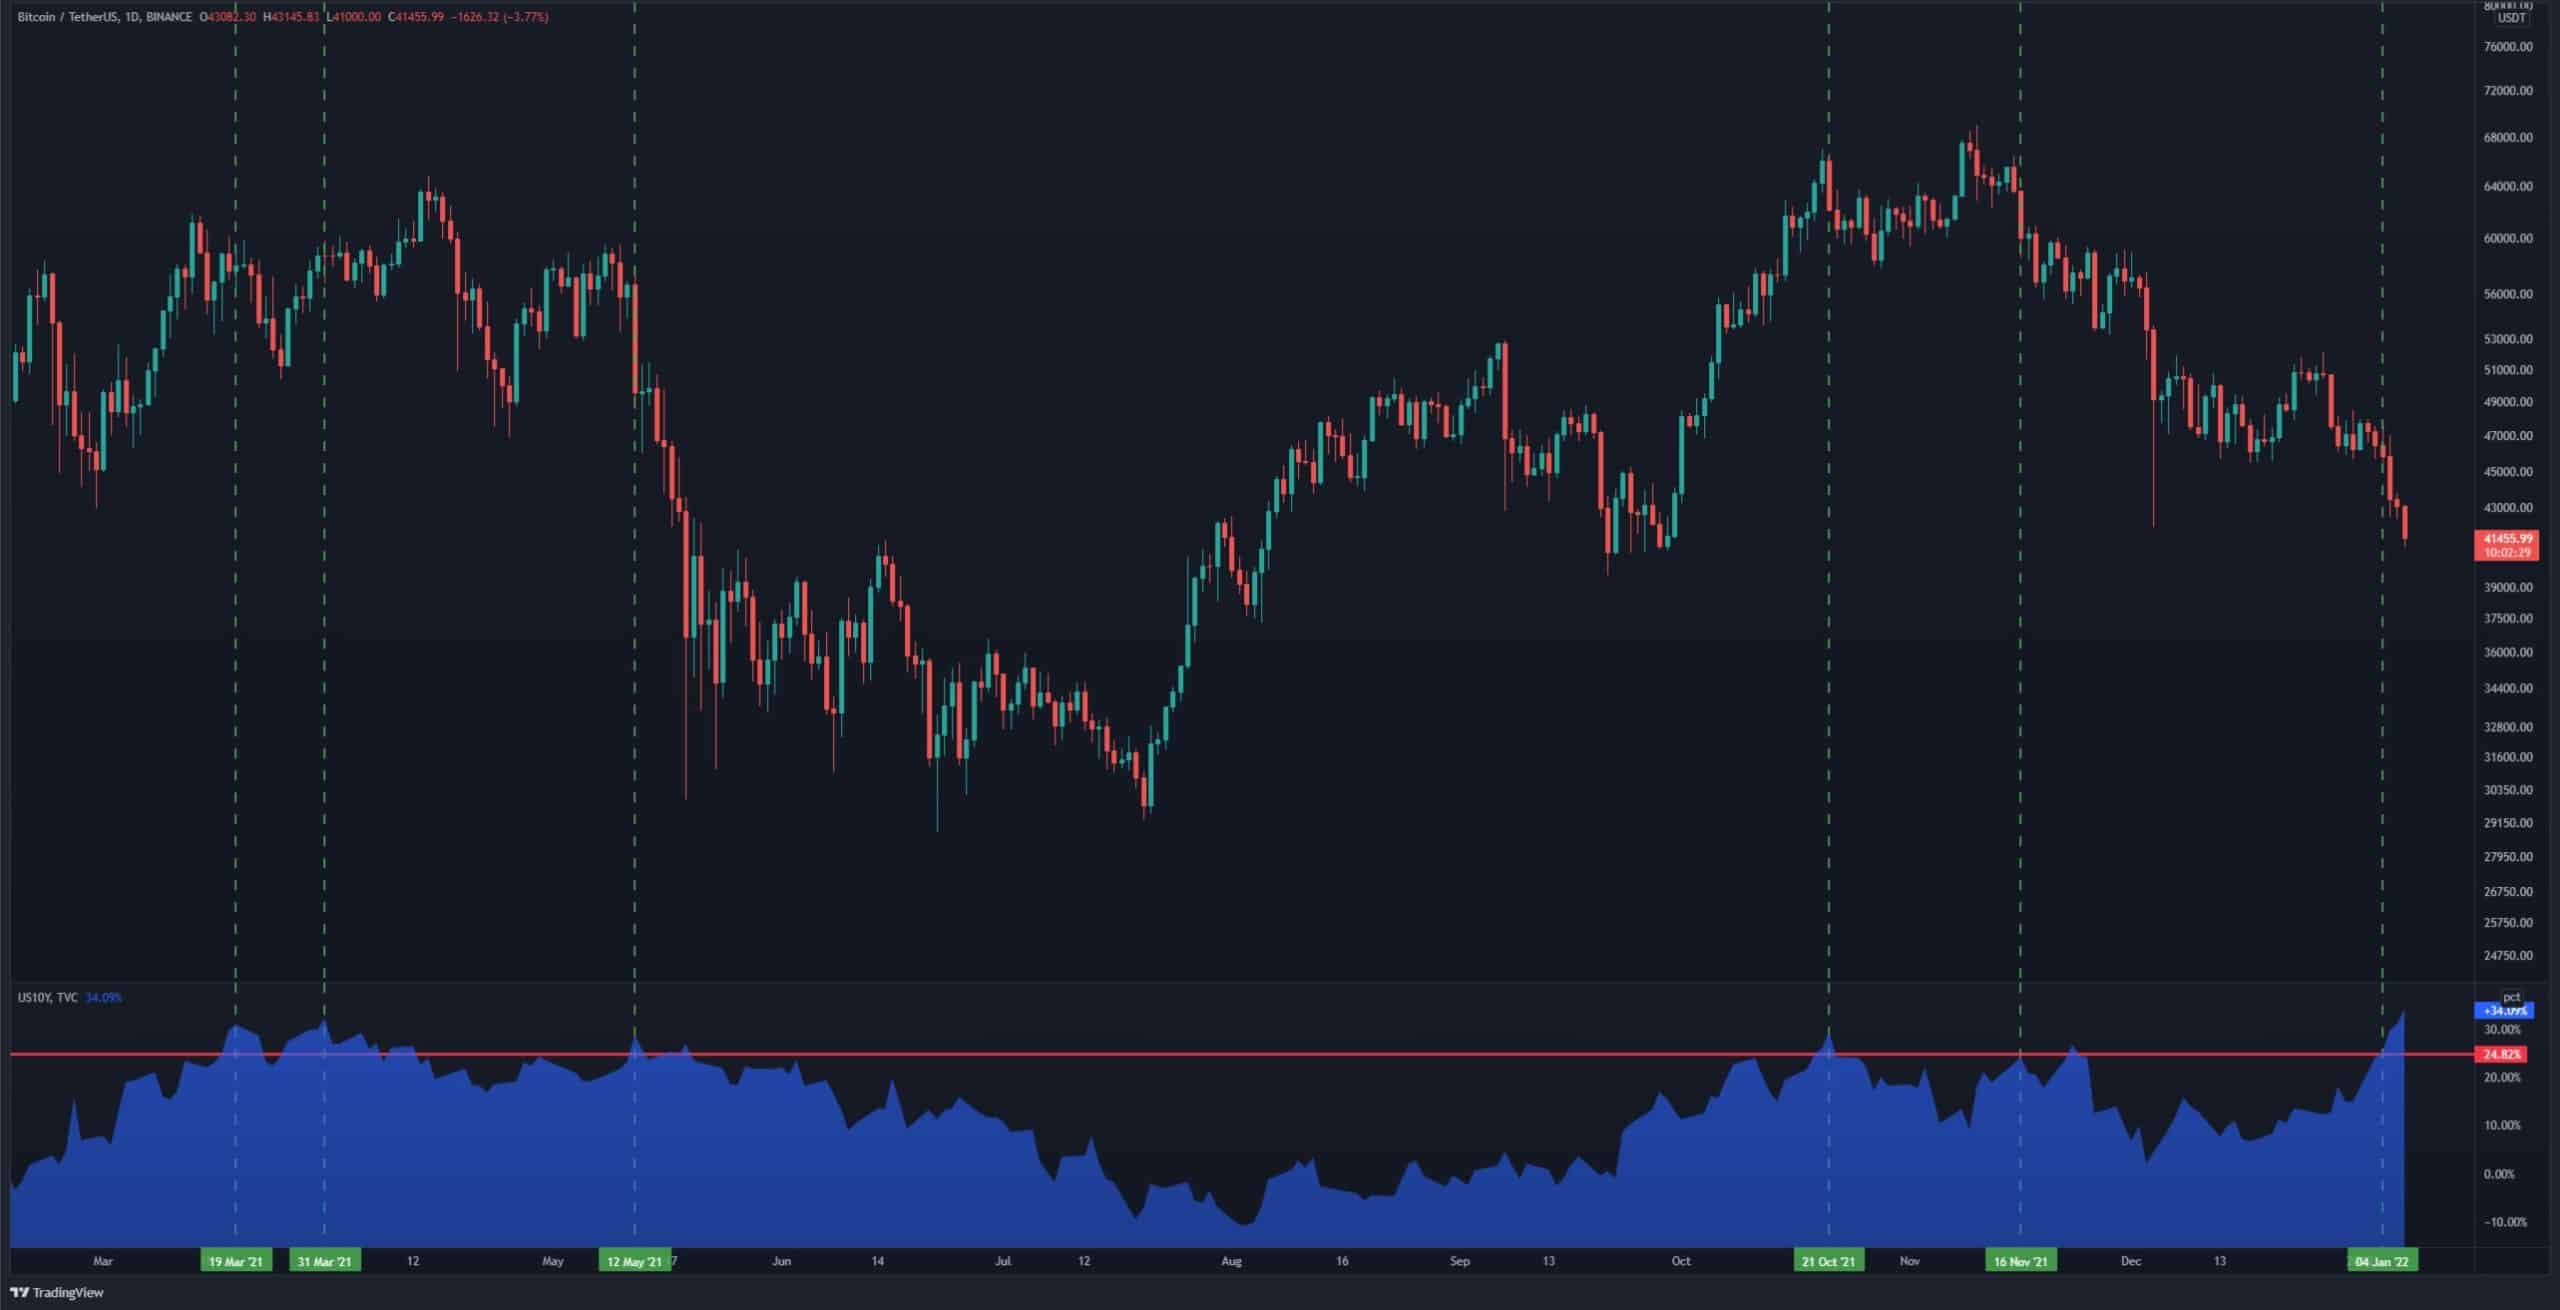
Looking at the macro indices, we see that the US10Y index has reached its highest level over the past year. Bitcoin has seen a major price correction whenever this index came at high levels (marked by a red horizontal line on the bottom of the following chart).
Also, the DXY index has not shown any bearish signs so far, which historically correlates negatively with Bitcoin.
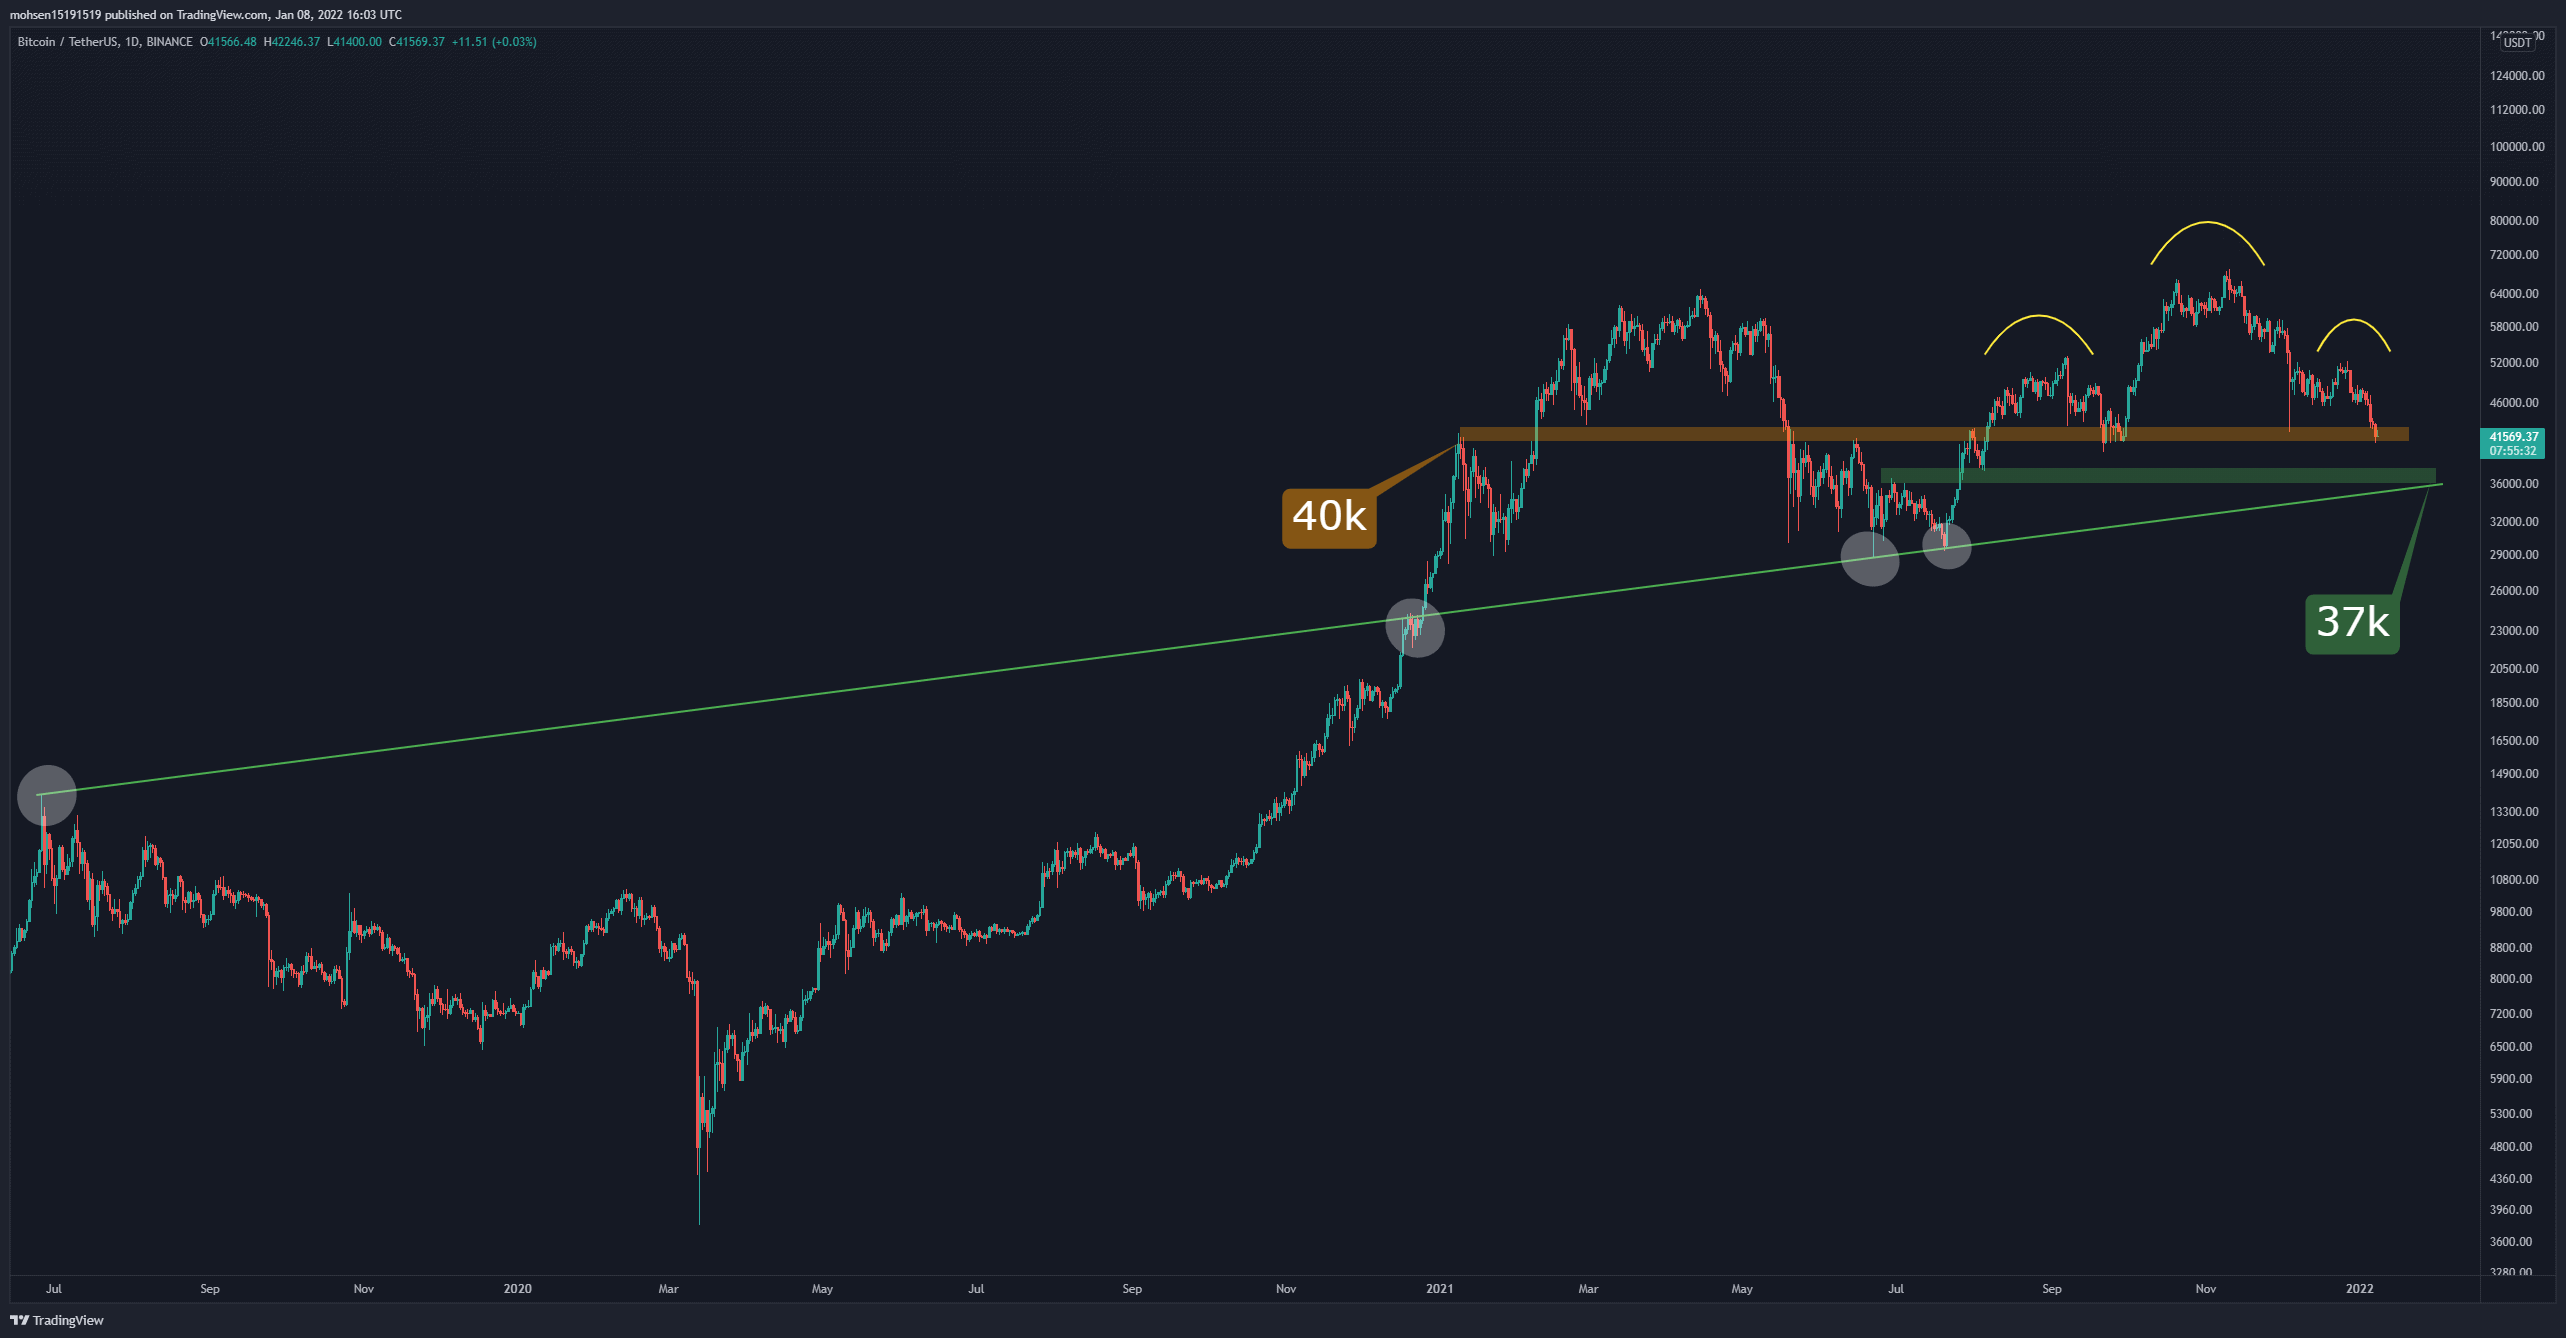
BTC faces the key price area of $40-42K on the daily chart, which has played a resistance and support role in the past year.
Breaking down this level will likely lead to the intersection of static and dynamic support at $37K. The Head & Shoulders pattern, a bearish pattern on an uptrend, has convinced many analysts that bitcoin will retest lower levels.
Futures & Spot Marker Analysis
By @CryptoVizArt
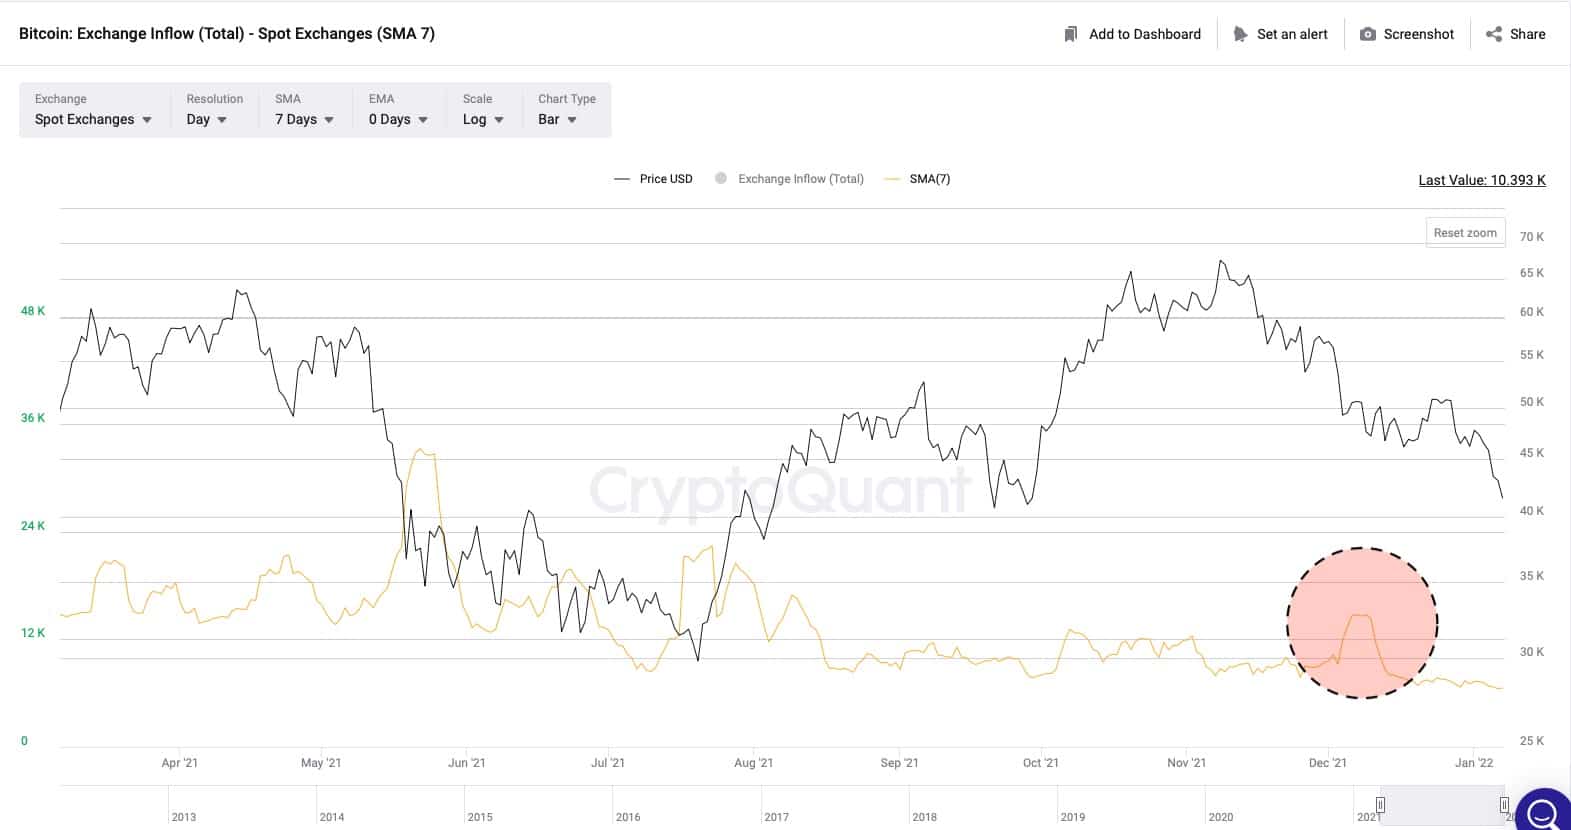
Over the last week, the 7-day moving average of Inflow Mean Value (inflowing transactions’ mean size) to Spot Exchanges showed a selling pressure in the spot market while the price action was trying to break above the $53K resistance.
Then, the market plunged towards $41K in the following days. Now, the spot market inflows have cooled down.
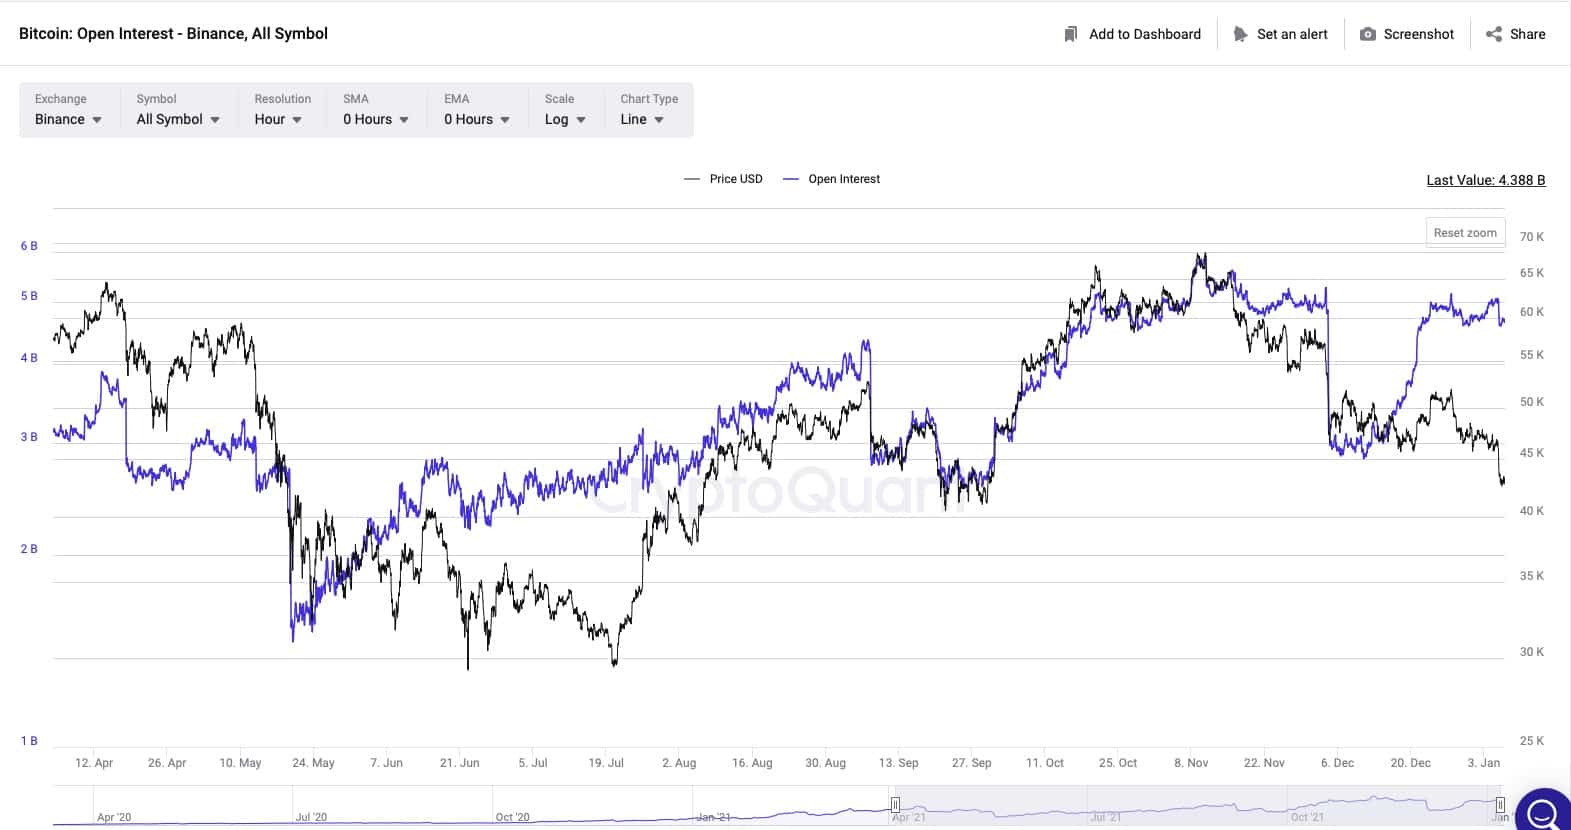
The worrying sign could be the high Futures Market’s open interest, primarily attributed to Binance. Even though the market was witnessing significant volatility during the last couple of weeks, the open interest in Binance has not seen any significant drop yet.
Therefore, many analysts are fearful about an immediate shadow to lower levels that will flush the long positions. However, it’s hard to determine if the long positions are the majority, based on the funding rate and some other metrics.
A possible explanation might be that big players are shorting the market to hedge against any potential bearish market. Therefore, a rational strategy for traders might be to lower their risk by staying away from high leveraged positions until the futures market starts to experience a growth in open interest, as we saw between May and July 2021.


