Bitcoin Analysis
Bitcoin’s price closed its daily candle on Sunday -$258 and snapped three consecutive days in green figures. Despite last week’s rally, BTC’s price is still below 40 on the RSI which historically has signified that bitcoin’s price is in a bear market.
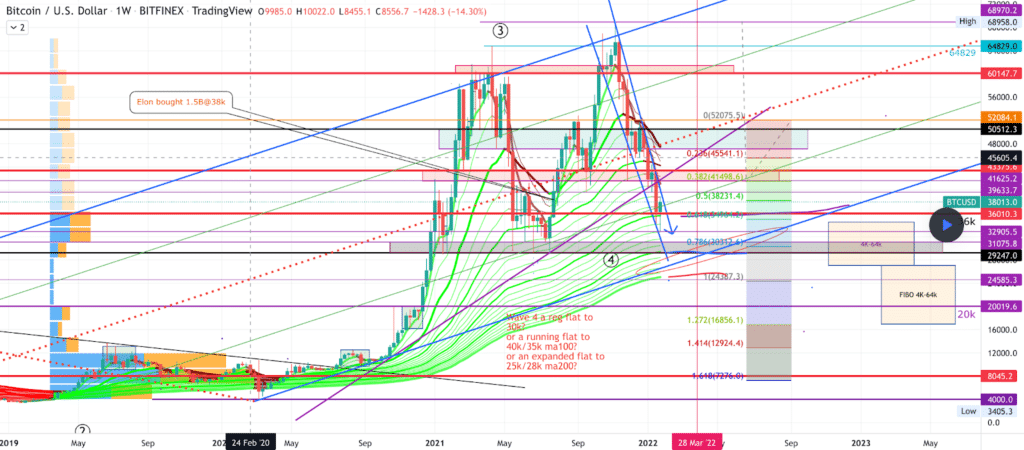
The first chart we’re examining today is the BTC/USD 1W chart below from xtremerider8. BTC’s price was again bumping up against the 0.5 fib level [$38,231.4] numerous times over the last week but was rejected from eclipsing that figure for its weekly candle close. If bullish BTC traders can eclipse the 0.5 fib level, their secondary target is the 0.382 [$41,498.6].
After a strong defense of the 0.5 fib level, bearish traders are now looking to send BTC’s price back down to the bottom of its channel for a re-test of the $30k level. Their primary target is to crack the 0.618 fib [$34,964.2] with a secondary target of 0.786 [$30,312.6]. If bearish traders can penetrate the $30k level to the downside the technical damage done will point to bears being vastly in control of BTC’s price action and they’ll be in their control zone.

Bitcoin’s Moving Averages: 20-Day [$41,142.12], 50-Day [$47,258.12], 100-Day [$51,414.63], 200-Day [$46,562.25], Year to Date [$41,142.12].
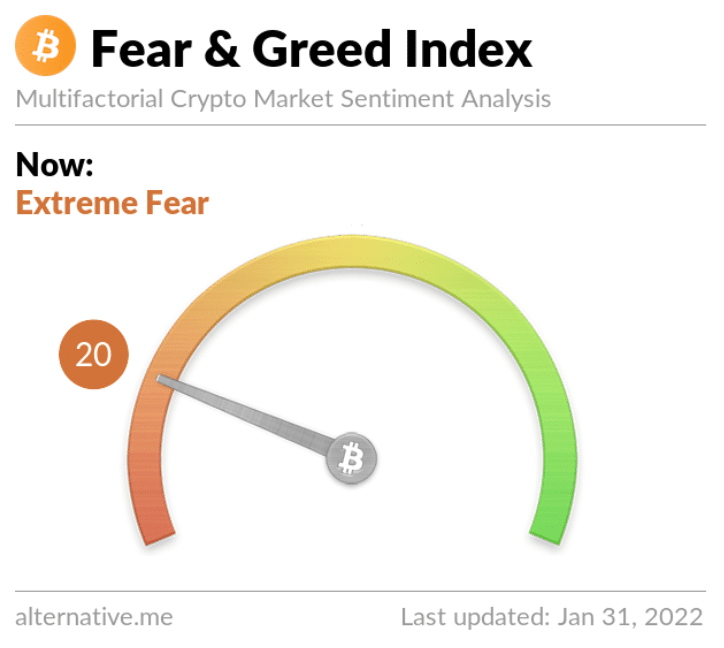
The Fear and Greed Index is 20 Extreme Fear and -9 from Sunday’s reading of 29 Fear.

BTC’s 24 hour price range is $37,503-38,386 and its 7 day price range is $33,505-$38,566. Bitcoin’s 52 week price range is $29,341-$69,044.
The price of bitcoin on this date last year was $33,604.
The average price of BTC for the last 30 days is $41,531.
Bitcoin’s price [-0.68%] closed its daily candle worth $37,939.
Ethereum Analysis
Ether’s price narrowly closed its daily candle in green figures on Monday and finished +$2.27. Ether’s momentum however is currently negative and at its lowest levels on the weekly timescale in the history of the asset.
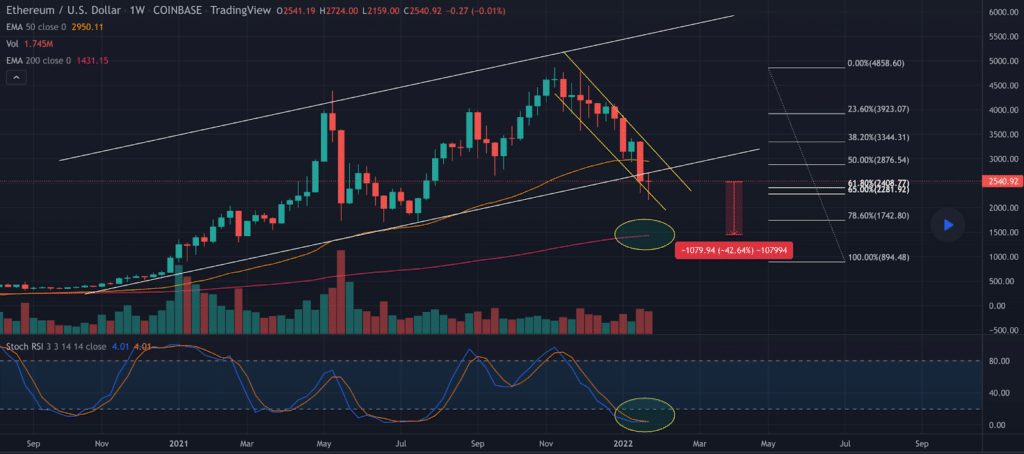
The second chart we’re analyzing today is the ETH/USD 1W chart from EdgarTigranyan. We can see that Ether’s price again closed outside of its long term ascending channel and failed to break back inside of the bottom of its range at the $2,7k level.
Bullish ETH traders were able to reclaim the 61.80% fib level [$2,408.77] and controlled much of last week’s price action but couldn’t crack that channel on the weekly time frame. Bearish ETH traders are now aiming to pivot where they’ve denied bullish Ether traders at the bottom of that range [$2,6k level] and send ETH’s price back down to test the 78.60% fib level [$1,742.8].

Ether’s Moving Averages: 20-Day [$3,065.72], 50-Day [$3,699.45], 100-Day [$3,758.19], 200-Day [$3,255.13], Year to Date [$3,065.72].
ETH’s 24 hour price range is $2,557-$2,635 and its 7 day price range is $2,204-$2,638. Ether’s 52 week price range is $1,312-$4,878.
The price of ETH on this date in 2021 was $1,317.
The average price of ETH for the last 30 days is $3,103.
Ether’s price [+0.09%] closed its daily candle on Sunday worth $2,602.6.
Avalanche Analysis
Avalanche’s price sold-off more than 5% on Sunday and closed its daily session -$3.8.
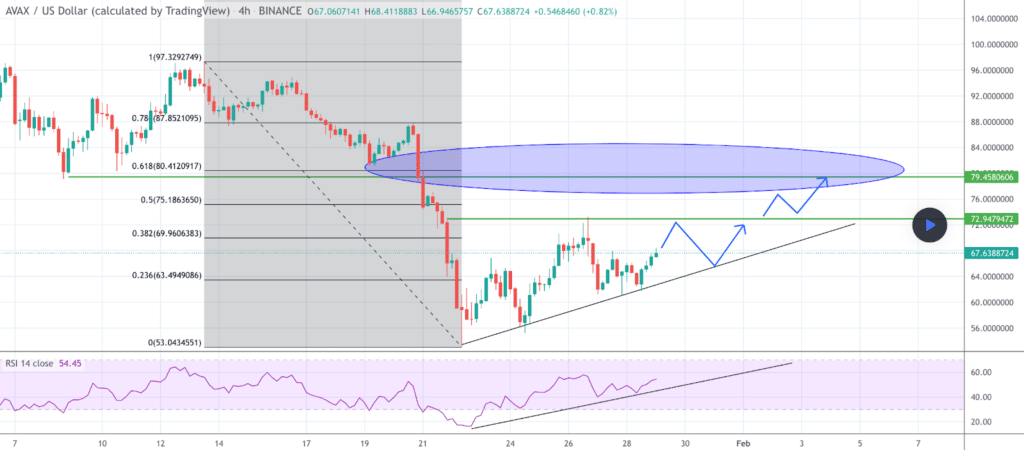
The AVAX/USD 4HR chart below from DT65 shows AVAX’s price ranging between a full retracement 0 [$53.04] and 0.618 [$80.41]. The next critical level for bullish AVAX traders to crack is the 0.38 fib [$69.96] with a secondary target of 0.5 [$75.18].
Conversely, AVAX bears are attempting to break the 4HR trendline and the 0.236 fib [$63.49] and again send Avalanche’s price back down to retest a full retracement at 0 [$53.04].

Avalanche’s 24 hour price range is $67.17-$72.25 and its 7 day price range is $55.94-$72.75. AVAX’s 52 week price range is $9.33-$144.96.
Avalanche’s price on this date last year was $13.18.
The average price for AVAX over the last 30 days is $85.34.
Avalanche’s price [-5.29%] closed its daily candle worth $68 on Sunday.
The post Bitcoin ($37k), Ethereum ($2.6), Avalanche Price Analyses appeared first on The Cryptonomist.


