

Bitcoin Analysis
Bitcoin’s price moved down over Wednesday’s daily session and BTC closed its daily candle -$674.9.
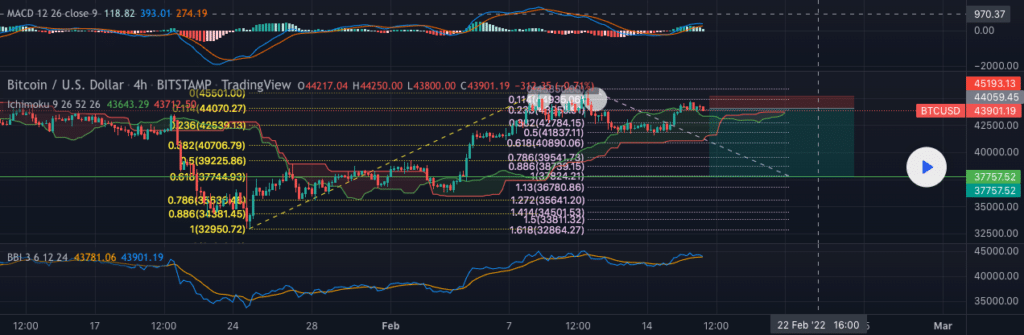
The first chart we’re analyzing today is the BTC/USD 4HR chart below from Freedom_CN. Traders will note that BTC’s price is currently trading in between the 0.236 fib level [$42,539.13] and 0.114 [$44,070.27], at the time of writing.
The bullish overhead targets for BTC market participants in the short-term are 0.236 and a secondary target of 0 [$45,501.00]. For bearish traders, they’re seeking to first hit 0.236 and then go down to test the 0.382 fib level [$40,706.79]. If bearish traders break 0.382, their third target is 0.5 [$39,225.86].
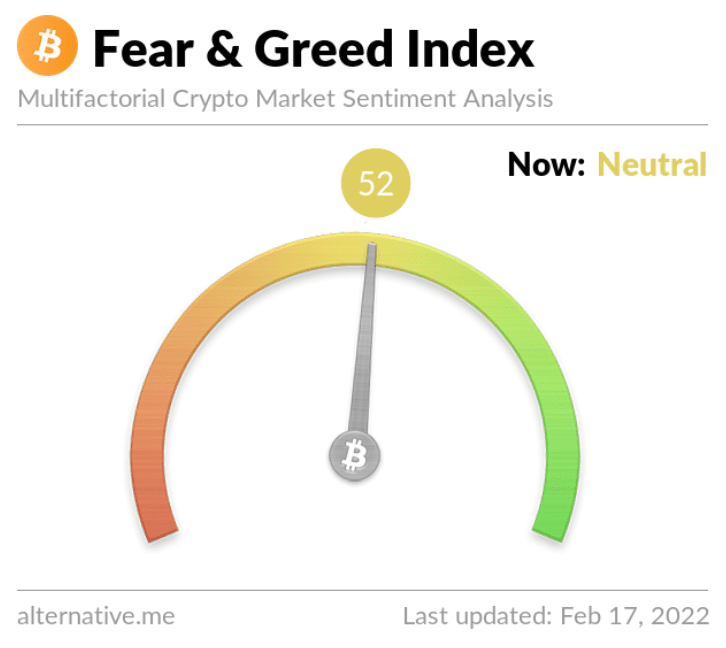
The Fear and Greed Index is 52 Neutral and +1 from Wednesday’s reading of 51 Neutral.
Bitcoin’s Moving Averages: 20-Day [$40,142.15], 50-Day [$43,711.59], 100-Day [$51,072.80], 200-Day [$45,661.86], Year to Date [$41,332.16].
BTC’s 24 hour price range is $43,514-$44,706 and its 7 day price range is $41,793-$45,481. Bitcoin’s 52 week price range is $29,341-$69,044.
The price of bitcoin on this date last year was $51,733.
The average price of BTC for the last 30 days is $40,327.
Bitcoin’s price [-1.51%] closed its daily candle worth $43,885 and in red figures for a second consecutive day.
Ethereum Analysis
Ether’s price also dropped more than 1% on Wednesday and closed its daily candle -$59.91.
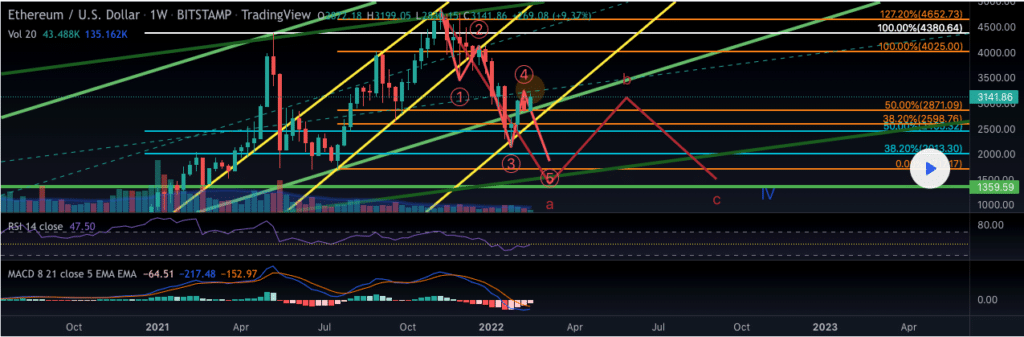
The ETH/USD 1W chart below from PsychoMario shows the most critical levels for Ether as the week winds down. Bullish Ether traders are looking overhead at the $4k level now on the weekly time frame. Of course, Ether will need the macro outlook and bitcoin to cooperate to again reach 1 [$4,025.00] over the next few months.
Conversely, bearish Ether traders are looking to snap 50.00% [$2,871.09] with a secondary target to the downside of 38.20% [$2,598.76].
Ether’s Moving Averages: 20-Day [$2,813.29], 50-Day [$3,333.89], 100-Day [$3,736.10], 200-Day [$3,234.53], Year to Date [$3,022.58].
ETH’s 24 hour price range is $3,060-$3,188 and its 7 day price range is $2,850-$3,253. Ether’s 52 week price range is $1,353-$4,878.
The price of ETH on this date in 2020 was $1,938.
The average price of ETH for the last 30 days is $2,853.
Ether’s price [-1.88%] closed its daily candle on Wednesday valued at $3,122.02.
Theta Analysis
Theta Network’s price concluded its daily session on Wednesday +$0.04 and in green figures for a second straight day.
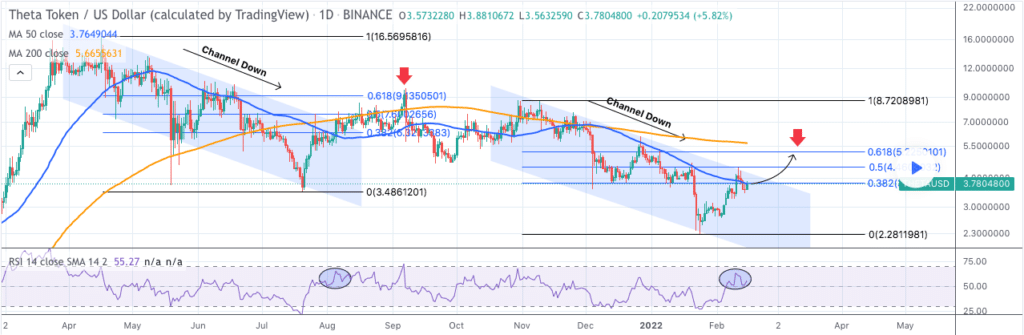
The third chart we’re analyzing today is the THETA/USD 1D chart below from TradingShot. Theta’s price is trading between 0.382 [$3.80] and 0.5 [$4.46].
If Theta bulls can break the 0.5 fib level their next overhead resistance is 0.618 [$5.22]. Above the 0.618 Theta bulls will again be seeking a trip back to the $6.50 level.
From the bearish perspective, they’re looking to push Theta’s price below 0.382 and again test the $3 level. Theta’s price tested that level earlier this year and bullish traders found support at 0 [$2.28].
Theta’s Moving Averages: 20-Day [$3.27], 50-Day [$3.96], 100-Day [$5.23], 200-Day [$6.01], Year to Date [$3.66].
Theta Network’s 24 hour price range is $3.77-$4.04 and its 7 day price range is $3.35-$4.28. Theta’s 52 week price range is $2.27-$15.72.
Theta’s price on this date in 2021 was $3.56.
The average price of Theta over the last 30 days is $3.37.
Theta Network’s price [+1.06%] closed its daily candle on Wednesday worth $3.89.
The post Bitcoin, Ethereum, Theta Price Analyses appeared first on The Cryptonomist.


