Bitcoin Analysis
Bitcoin’s price continued making lower highs on Wednesday and concluded its daily session -$1,007.
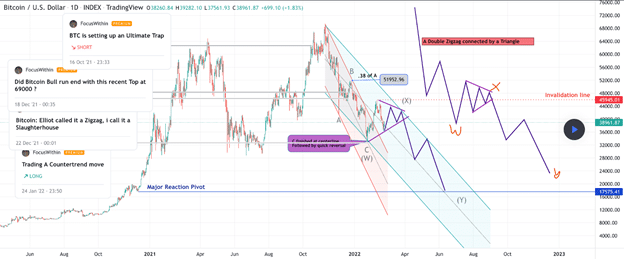
The BTC/USD 1D chart from FocusWithin shows the potential that BTC’s price is in the midst of an WXY pattern and setting up for lower prices. If the chartist is correct, the pattern completion zone for BTC’s price could be somewhere around the $17,5k level.
Of course, if BTC’s price breaks out of the X wave of this structure and outside of its current descending channel this analysis will be negated.
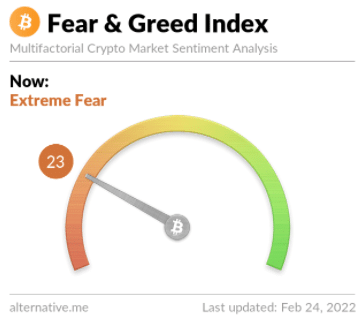
The Fear and Greed Index is 23 Extreme Fear and -2 from Wednesday’s reading of 25 Extreme Fear.
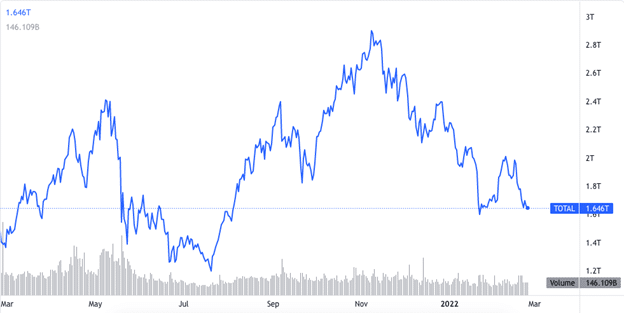
The aggregate crypto market cap is also bumping up against overhead resistance [at the time of writing] after bulls lost the $1.65 trillion level.
Bitcoin’s Moving Averages: 20-Day [$40,463.77], 50-Day [$42,791.33], 100-Day [$50,547.61], 200-Day [$45,508.55], Year to Date [$41,007.68].
BTC’s 24 hour price range is $37,434-$39,231 and its 7 day price range is $36,629-$44,113. Bitcoin’s 52 week price range is $29,341-$69,044.
The price of bitcoin on this date last year was $49,849.
The average price of BTC for the last 30 days is $40,020.
Bitcoin’s price [-2.63%] closed its daily candle worth $37,292 and finished back in red figures after Tuesday’s brief reprieve.
Ethereum Analysis
Ether’s price also sold-off more than 2% on Wednesday and finished its daily candle -$59.16.
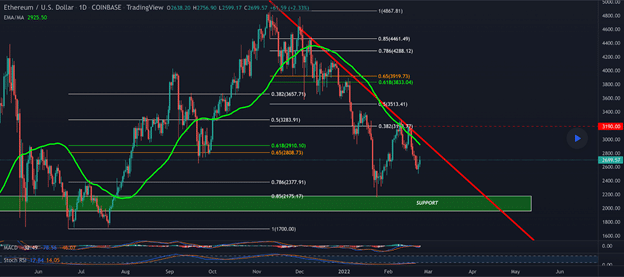
The ETH/USD 1D chart below RSibayan shows Ether’s price trading in between the 0.786 fibonacci level [$2,377.91] and 0.618 [$2,910.10].
The most important target in the short-term for Ether bulls is 0.65 [$2,808.73]. If bullish Ether market participants can regain that level their next aim is 0.618 with a third target of 0.5 [$3,283.91].
Bearish targets to the downside for Ether bears are 0.786 [$2,377.91], 0.85 [$2,175.17] and 1 [$1,700.00].
Ether’s Moving Averages: 20-Day [$2,844.75], 50-Day [$3,208.72], 100-Day [$3,704.76], 200-Day [$3,216.96], Year to Date [$2,982.70].
ETH’s 24 hour price range is $2,614-$2,752 and its 7 day price range is $2,522-$3,154. Ether’s 52 week price range is $1,353-$4,878.
The price of ETH on this date in 2021 was $1,628.
The average price of ETH for the last 30 days is $2,792.
Ether’s price [-2.24%] closed its daily candle on Wednesday valued at $2,578.09 and has finished in red digits for seven of the last eight days.
Cardano Analysis
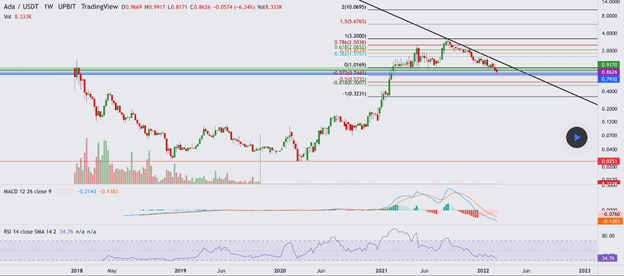
Cardano’s price is continuing its larger downtrend and also trended lower on Wednesday. When ADA traders settled up at the close of Wednesday’s daily session ADA’s price was -$.021.
The ADA/USD 1W chart below from esmalch shows that ADA’s price is still experiencing weak demand and continuing a long term downtrend.
Cardano’s price is ranging between -.272 [$0.74] and 1 [$1.01]. Cardano market participants that want to send ADA’s price higher need to break the $1.01 level with a secondary target of 0.382 [$1.57] and a third target of 0.5 [$1.80].
From the bearish perspective, bearish traders are looking to snap the $0.74 level with a secondary target of -0.5 [$0.57] and a third target of -0.618 [$0.50].
Cardano’s Moving Averages: 20-Day [$1.05], 50-Day [$1.19], 100-Day [$1.53], 200-Day [$1.67], Year to Date [$1.14].
Cardano’s 24 hour price range is $0.87-$0.95 and its 7 day price range is $0.82-$1.09. ADA’s 52 week price range is $0.81-$3.09.
Cardano’s price on this date last year was $1.06.
The average price of ADA over the last 30 days is $1.05.
Cardano’s price [-2.33%] closed its daily session worth $0.865 on Wednesday and ADA has closed in red figures for six of the last eight days.
The post Bitcoin, Ethereum, Cardano Price Analyses appeared first on The Cryptonomist.


