Bitcoin Analysis
Bitcoin’s price finished marginally down [-$490] on Wednesday after concluding the two prior days up over 16%.
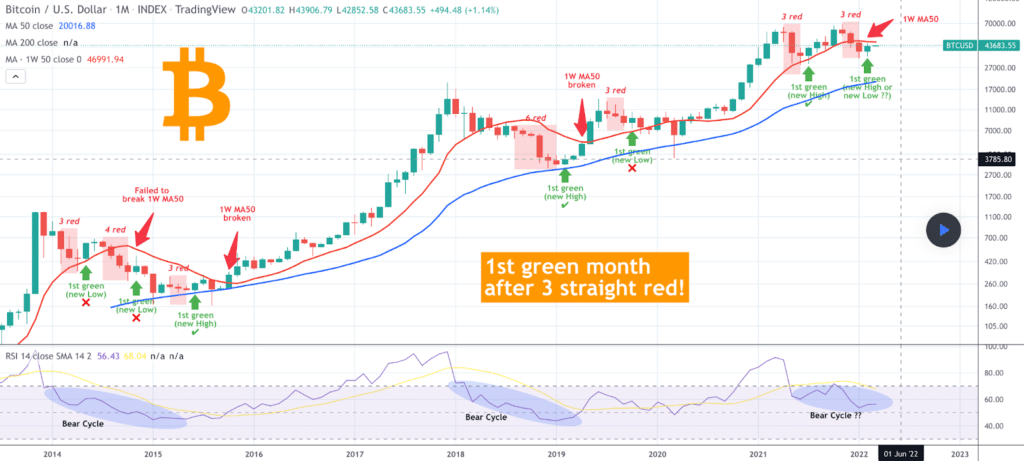
The first chart we’re analyzing today is the BTC/USD 1M chart below from TradingShot. BTC’s price closed the monthly timescale in green figures for the first time in 3 months following February’s price reversal to the upside.
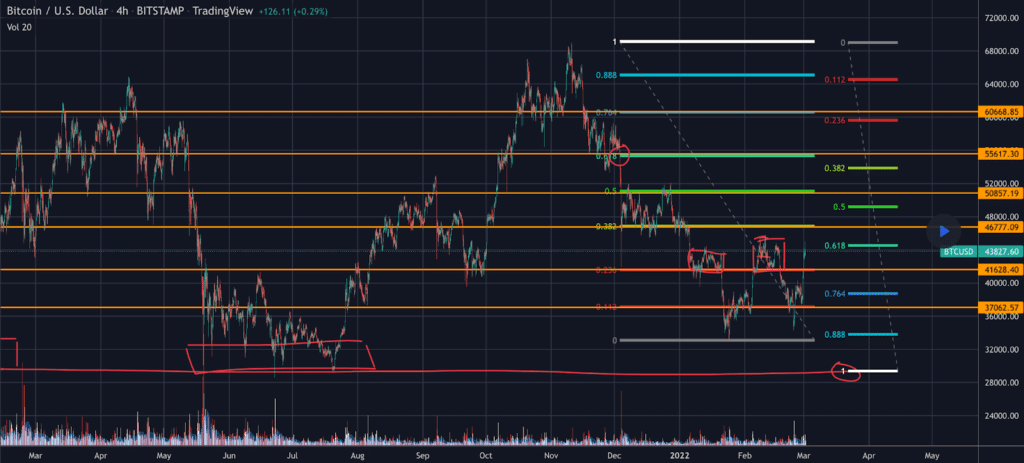
The second bitcoin chart we’re analyzing today is the BTC/USD 4HR chart from Noobincrypt. BTC’s price is trading between 0.764 [$38,901.52] and 0.618 [$44,368.38] on the daily timescale, at the time of writing.
Bullish BTC traders have targets of 0.618, 0.5 [$48,994.18], and 0.382 [$53,704.09] overhead. The targets for bearish BTC traders to the downside are the 0.764 fib level, 0.88 [$34,023.30] and 1 [$29,649.91]
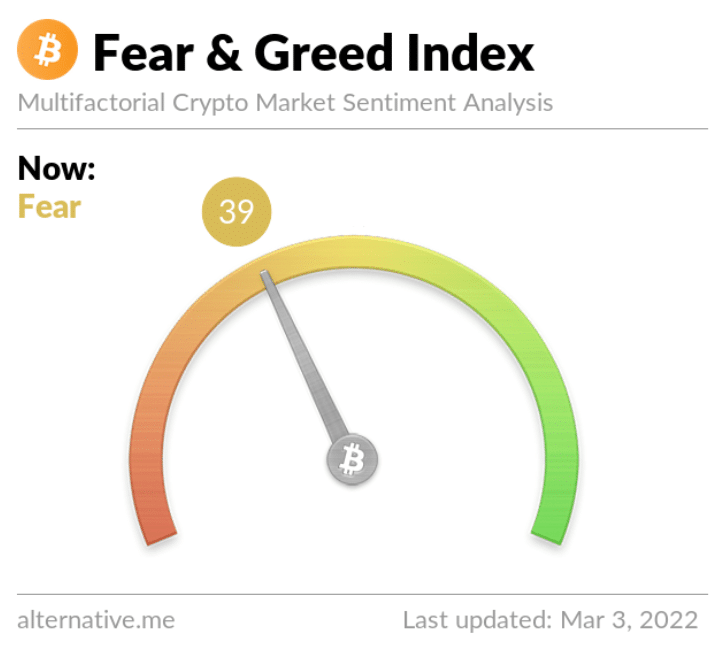
The Fear and Greed Index is 39 Fear and -13 from Wednesday’s reading of 52 Neutral.
Bitcoin’s Moving Averages: 20-Day [$41,333.75], 50-Day [$42,098.91], 100-Day [$49,824.27], 200-Day [$45,582.62], Year to Date [$41,019.14].
BTC’s 24 hour price range is $43,470-$44,968 and its 7 day price range is $34,740-$44,968. Bitcoin’s 52 week price range is $29,341-$69,044.
The price of bitcoin on this date last year was $50,577.
The average price of BTC for the last 30 days is $41,071.
Bitcoin’s price [-1.10%] closed its daily candle worth $43,952 and in red digits for the first time in three days.
Ethereum Analysis
Ether’s price has finished in green figures for five of the last seven days and concluded Wednesday’s daily session barely in red figures [-$28.93].
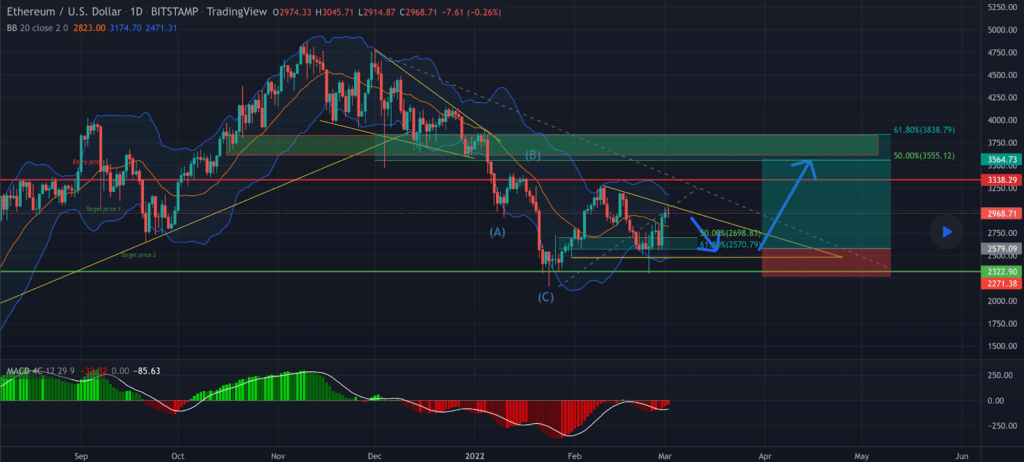
The second chart we’re looking at today is the ETH/USD 1D chart from vf_investment. Ether’s price is currently in an uptrend on the daily time frame and closing in on a technical break out to the upside of a triangle pattern.
For bullish traders to break out to the upside of its current pattern, the price for Ether traders to crack is $3,045.80.
Ether’s Moving Averages: 20-Day [$2,892.48], 50-Day [$3,090.36], 100-Day [$3,667.41], 200-Day [$3,221.89], Year to Date [$2,960.97].
ETH’s 24 hour price range is $2,924-$3,029 and its 7 day price range is $2,336-$3,029. Ether’s 52 week price range is $1,459-$4,878.
The price of ETH on this date in 2021 was $1,579.
The average price of ETH for the last 30 days is $2,875.
Ether’s price [-0.97%] closed its daily candle on Wednesday worth $2,946.73.
Polkadot Analysis
Polkadot’s price also wrapped up Wednesday’s daily session in red digits [-$0.27] for a second straight day.
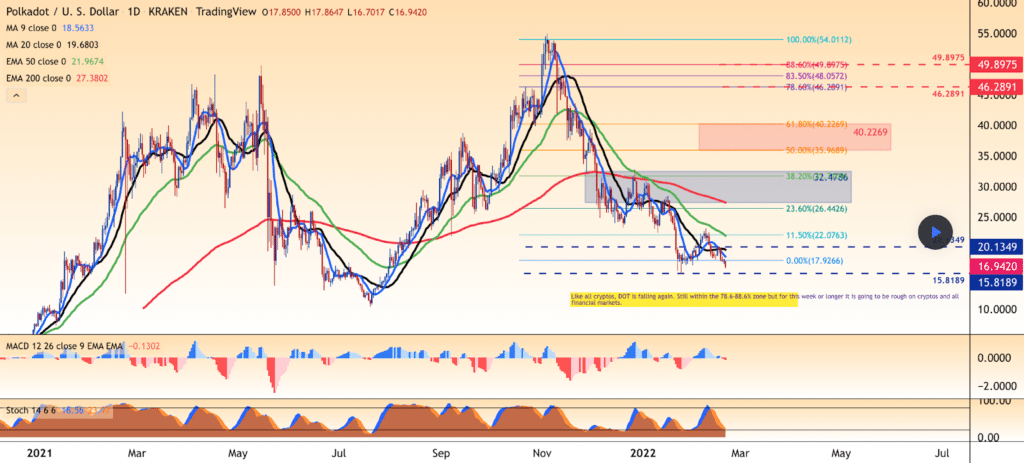
The third chart we’re looking at today is the DOT/USD 1D chart below from stikytrading. Polkadot’s price is trading between the 0.00% fib level [$17.92] and 11.50% [$22.07].
Bullish Polkadot market participants are aiming overhead at 23.60% [$26.44], 38.20% [$32.47], and 50.00% [$35.96] in the short-term.
Conversely, bearish DOT market participants are seeking a move back below the 0.00% fib level followed by a secondary target of the $15.81 level.
Polkadot’s Moving Averages: 20-Day [$18.80], 50-Day [$22.19], 100-Day [$30.63], 200-Day [$26.98], Year to Date [$21.16].
Polkadot’s 24 hour price range is $18.48-$19.24 and its 7 day price range is $14.27-$19.42. DOT’s 52 week price range is $10.37-$54.98.
DOT’s price on this date last year was $37.08.
The average price of DOT over the last 30 days is $18.88.
Polkadot’s price [-1.43%] closed its daily candle valued at $18.61 on Wednesday.
The post Bitcoin ($43k), Ethereum ($2.9k), Polkadot Price Analyses appeared first on The Cryptonomist.


