Key Insights
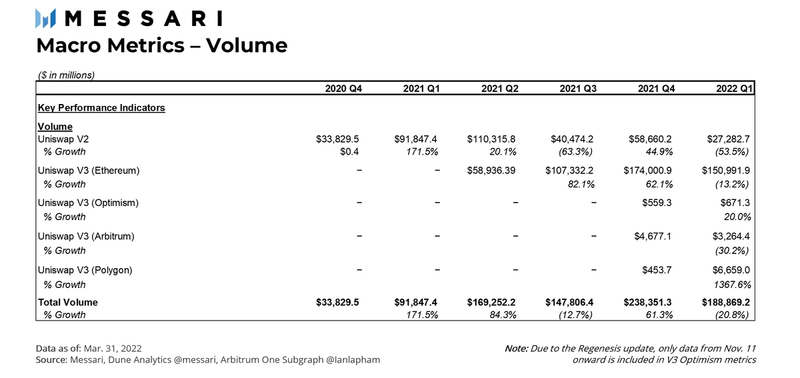
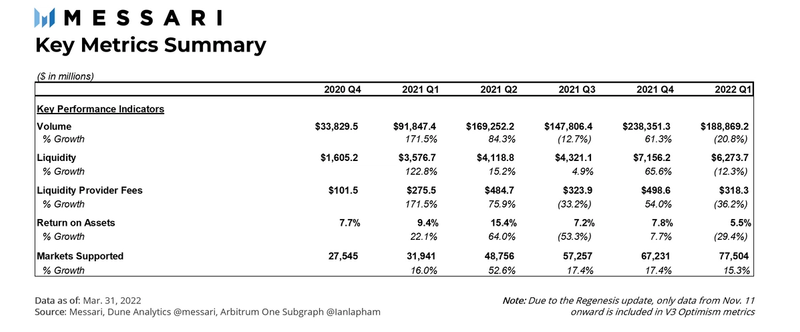
- Total trading volume and, correspondingly, liquidity provider fees, fell in Q1 2022 as the surge of interest in crypto and NFTs from Q4 2021 subsided.
- Uniswap on Polygon found organic growth and became the leading non-Ethereum platform for V3 by transaction volume even though it was the latest network to go live; additional liquidity mining incentives in the upcoming quarter should continue to help drive growth.
- The community is exploring areas for further expansion onto Celo and Gnosis Chain.
- The Uniswap Grants Program gave out the largest grant wave in its history in Wave 6, which included a mix of grant proposals from the end of 2021.
Introduction to Uniswap
Uniswap facilitates the trading of tokens on the Ethereum network along with scaling solutions such as Optimism, Arbitrum, and Polygon. The protocol is recognized as a pioneer among decentralized exchanges (DEXs), first for its popularization of the X*Y=K constant product pricing curve of pooled liquidity in V2 – and subsequently for its concentrated liquidity and staggered trading fee features in V3. The constant product pricing curve has since been implemented across many other DEXs in the industry. The concentrated liquidity model and fee tiers continue to remain relatively unique across DEX applications.
To quickly recap, AMMs pair tokens into pools balanced by the aforementioned algorithm. Liquidity providers (LPs) can deposit funds into those liquidity pools where traders make trades by swapping tokens in and out — in effect, making trades with the pool. In exchange for providing liquidity, LPs earn transaction fees paid by the traders.
Important updates to the protocol in the past quarter include the rapid growth of trading activity on Polygon’s Proof-of-Stake (PoS) chain (hereinafter: Polygon). Though Polygon was the last of Uniswap’s scaling solutions to launch in 2021, Uniswap V3 transaction volume quickly surpassed other notable DEXs on Polygon, such as SushiSwap, QuickSwap, Balancer, on fractions of the total value locked (TVL) for other DEXs. Q1 2022 saw some important governance proposals as well: launches of V3 on Gnosis Chain and Celo have passed temperature checks and will be up for an on-chain vote shortly. One should also reasonably expect additional expansion proposals later this year.
After a volatile Q4 trading quarter, 2022 represents an opportunity for normalization. Benchmarking quarter-over-quarter metrics will shed light on how Uniswap and its LPs respond to concerns of a bear market. A full appendix of quarterly data is available at the end of the report.
Macro Overview
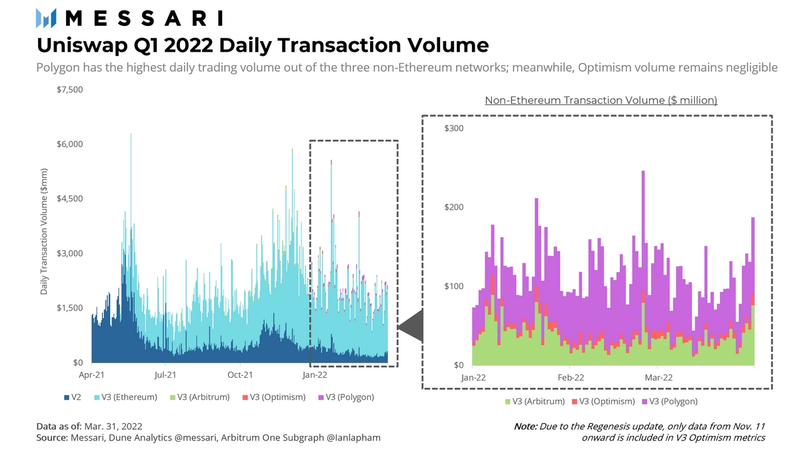
On the whole, Uniswap trading volume in Q1 2022 was 53.5% lower than the previous quarter. This corresponds with the global crypto market, which hit its peak market capitalization in Q4 2021 at $3 trillion and has since come back down to $2 billion. When token prices go up, trading volume generally increases as retail inventors become more interested; when token prices decrease, retail investors lose interest in crypto. And unlike Q4 2021, which saw both the resurgence of NFTs and all-time highs for BTC and ETH, trading activity in Q1 2022 has been more muted.
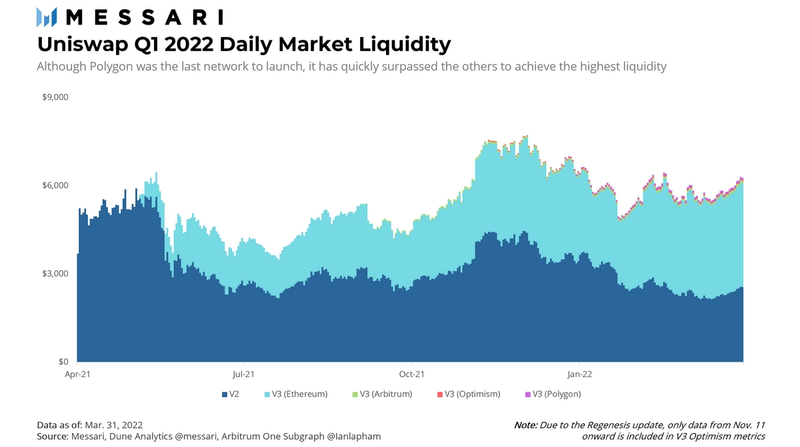
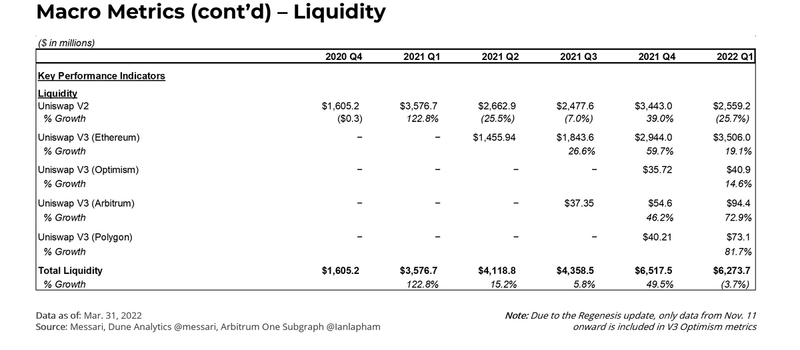
Overall market liquidity dipped in Q1 2022, but to a lesser degree than volume. V2 was the only network to see a liquidity decline over the quarter, falling by 25.7%, while all the others saw nominal increases at a small scale. Since V2 includes more long-tail token pairs, a decline in V2 liquidity does coincide with lower retail trading volume. Meanwhile, market liquidity really shined in Uniswap’s so-called scaling solutions, particularly Polygon. Polygon jumped almost 81.7% compared to the end of Q4 when it had just launched. The implications of Polygon’s big win will be revisited throughout the report. Arbitrum and Optimism each saw growth too at 72.9% and 34.7%, respectively.
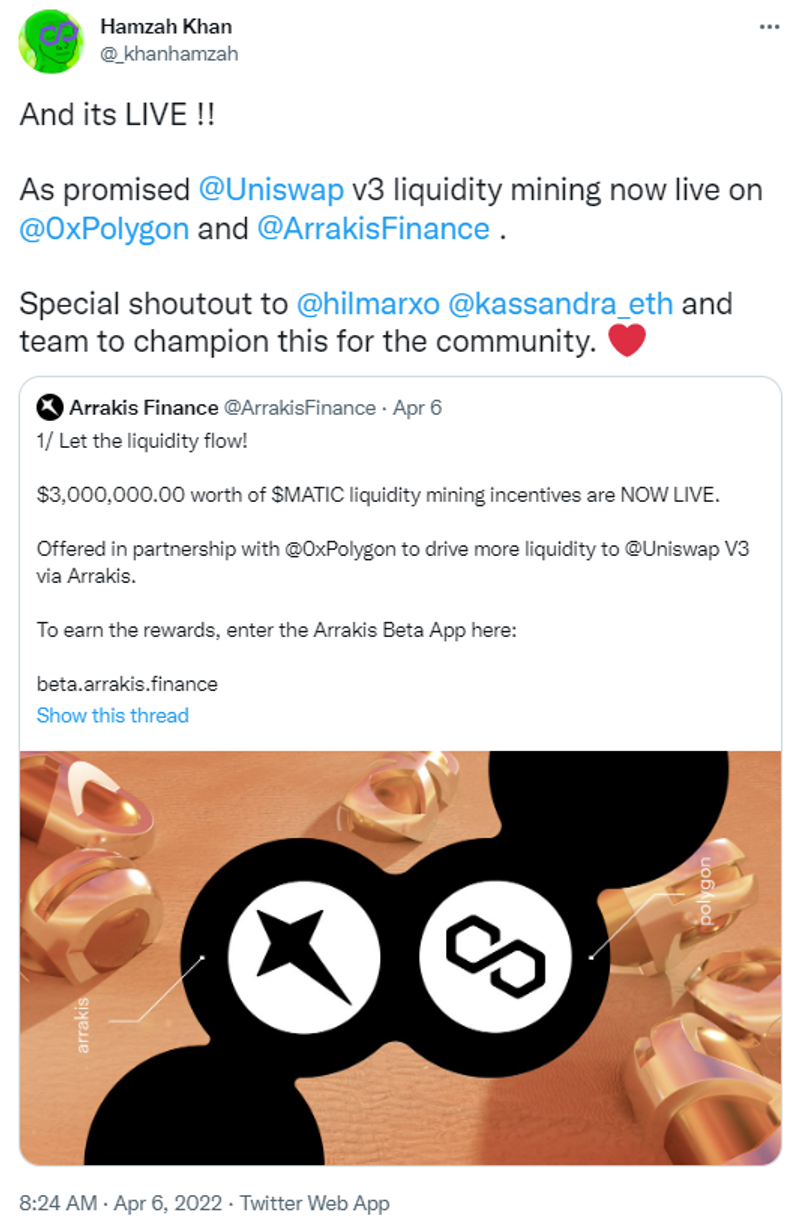
Polygon’s liquidity growth is particularly impressive given the lack of liquidity mining incentives for users in Q1. For context, when the initial governance proposal was made, up to $15 million was set aside by the Polygon team for liquidity mining purposes and another $5 million was prepared to support the ecosystem. As of the first week of April, these incentives have now been implemented. Only time will tell how much of a boost it’ll give to Polygon’s existing success.
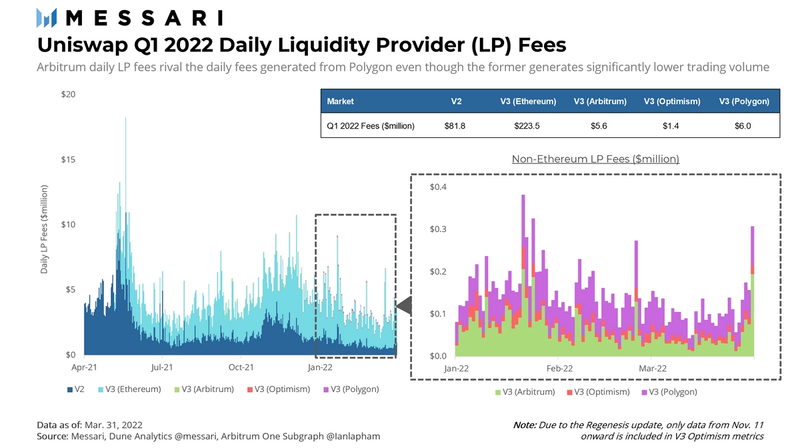
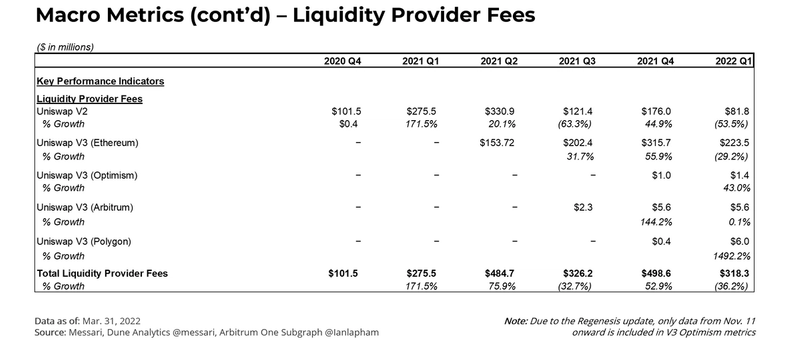
Daily LP fees fell 36.2% in Q1 2022 after jumping 54.0% in Q4 2021, resulting in final quarter-end numbers similar to the end of Q3 2021. Q4’s numbers were such outliers due to the mainstream popularity of NFTs and all-time highs for both BTC and ETH. On the non-Ethereum front, Arbitrum gives Polygon a serious run for its money while Optimism lags behind. This data implies Polygon sees more trading of blue-chip token pairs (and thus, lower fees) while popular Arbitrum pairs trade in the higher fee tiers.
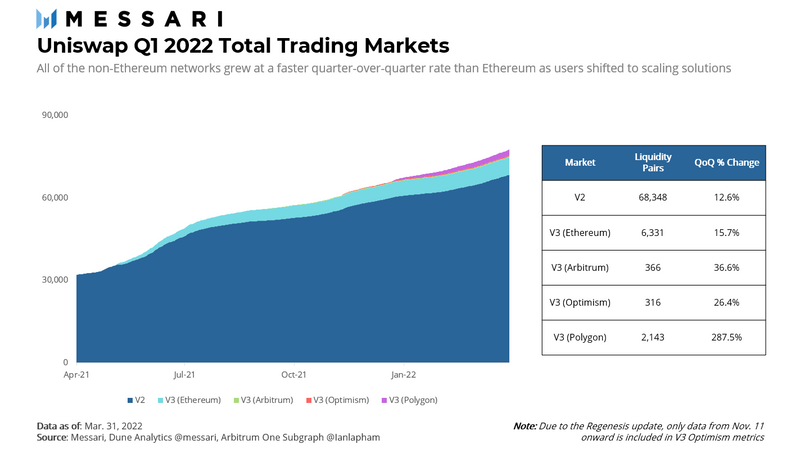
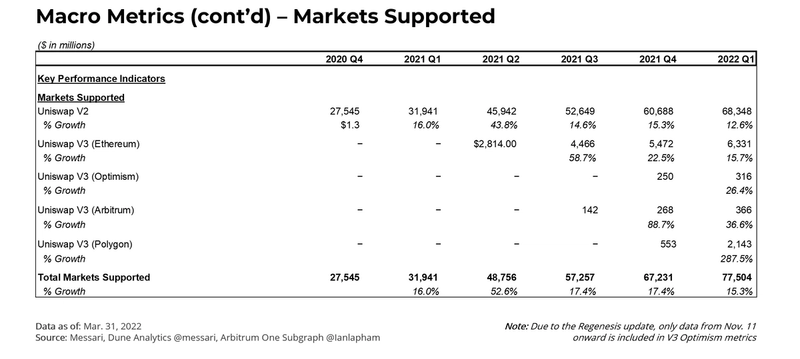
Total trading markets also continued to climb from the previous quarter, across all products from V2 on Ethereum to each of Uniswap’s non-Ethereum networks. V2 continues to make up the vast majority of total available markets. V3 on Ethereum and Polygon comprise 11% of active markets while Optimism and Arbitrum remain negligible. As with market liquidity, Polygon grew the quickest in Q1, jumping almost 300% from the previous quarter. Given all the data, it’s clear Uniswap has found a home on Polygon.
Micro Overview
The markets on V3, while fewer in count, continue to trade more blue-chip token pairs. Trading activity on V3 also continues to rise on a quarter-over-quarter basis.
Top V2 Markets
The top four most actively traded V2 markets for Q1 2022 were the following pools:
- USDC/WETH
- USDT/WETH
- SAITAMA/WETH
- FXS/FRAX
Together, the four pools represent less than 0.001% of the count of tradeable V2 markets but comprise 19.4% of total trading volume. Activity – and trends – from these four markets can be seen as leading indicators for the direction of the overall V2 ecosystem. However, given the trading pattern similarities USDT/WETH shares with USDC/WETH, further analysis of the pool was replaced in favor of the FXS/FRAX market for the purposes of this report.
USDC/WETH
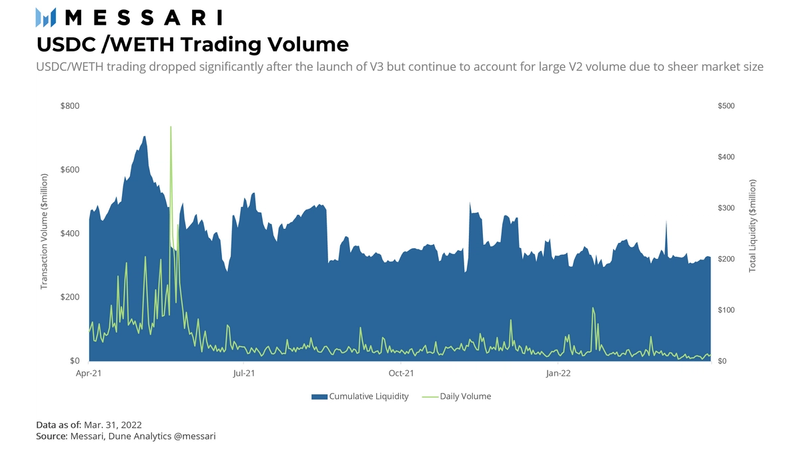
Data from USDC/WETH shows trading volume continuing to decline after the launch of V3. V2 volume in the most recent quarter only accounted for 3.2% of total volume, only a tenth of V2 volume in Q2 2021. A total of $2.7 billion was traded in the V2 pool in Q1 2022, a 24.5% decline from the previous quarter. The capital efficiency of V3 makes it likely USDC/WETH trading activity on V2 will continue to decline and give way to further volume increases in its V3 counterpart.
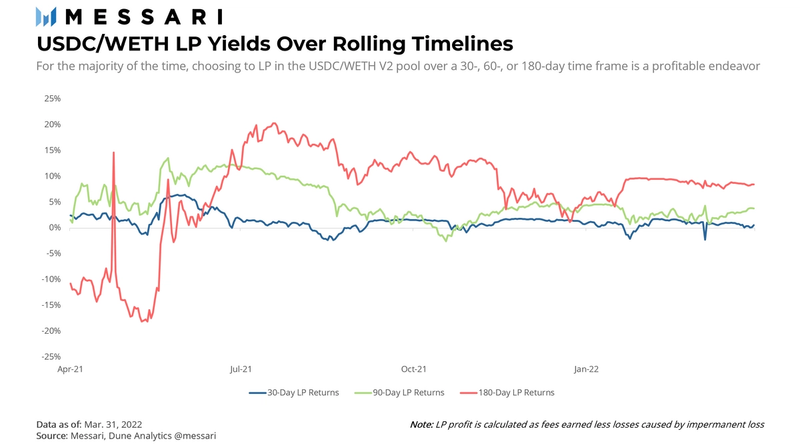
The chart above represents our methodology of tracking LP profits/losses. Three scenarios were evaluated to compare the profitability of providing liquidity to this pool: a user providing liquidity for 30-, 90-, and 180-day windows. These windows were rolled through the entire last year to compare the profitability of these actions across time. For each window period, the corresponding impermanent loss caused by price change in the first and last day of the window was deducted from the equivalent yield generated from trading fees. The result is a moving net profit metric displayed above.
The USDC/WETH pair is a prime market to take a liquidity stake in, given the high volume of trades facilitated by the pool. Because most price fluctuations would be hedged by trading fees earned by LPs, one could expect decent returns when trading volume is high.
Of the 365 days since Q2 of last year, only 52 of the rolling 180-day returns would have yielded losses for LPs who would’ve chosen to retract their liquidity on any of those days. Even fewer days would have led to a loss for shorter-term LPs: for rolling 30-day LPs, the total impermanent loss would have exceeded fees for only 45 days of the year and only 12 days for those supplying rolling 90-day LPs.
In Q1 2022 alone, performance gets even better. All rolling 90- and 180-day LP positions over the entire 90 days in Q1 would have yielded a positive profit. For the rolling 30-day LP, every position would have been profitable, except for January 22-27th and March 5th.
FXS/FRAX
Both tokens in the final V2 pool, FXS and FRAX, are tokens used by the Frax Protocol, an algorithmic stablecoin protocol built on a hybrid seigniorage model. FRAX is the actual stablecoin pegged to the US Dollar; FXS is the governance and value capture token used as partial collateral for FRAX. As a hybrid model, FRAX is collateralized by both the FXS token and a fraction of another stablecoin.
The extent to which the percentage of underlying collateral made up by FRAX and USDC or another stablecoin is determined by the collateral ratio, which changes with demand for FRAX. If FRAX supply is expanding, less stablecoin is needed; if FRAX is retracting, a higher collateral ratio of stablecoin is needed.
What’s important to know is that Frax has an FXS buyback program (Frax1559) for excess collateral. This occurs when yields are earned by the protocol’s stablecoin collateral, causing total collateral to increase above the required collateral ratio. Frax uses the extra earned capital to mint new FRAX tokens and buy back outstanding FXS tokens.
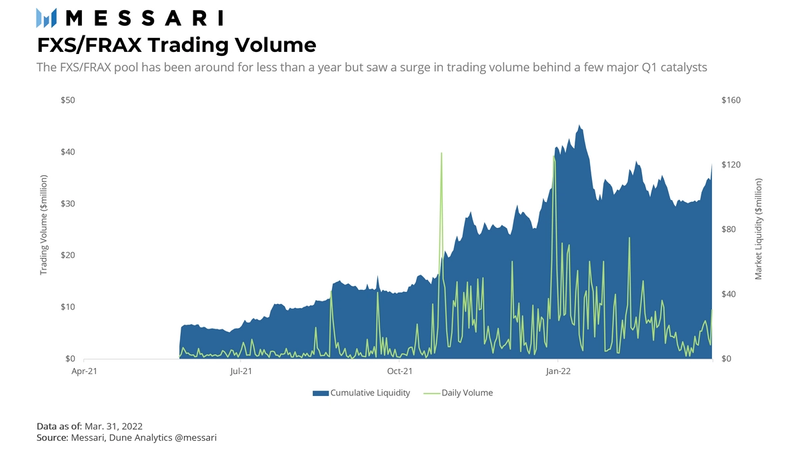
Thus, the trading volume of the Uniswap FXS/FRAX pool is driven by the Frax1559 buyback program and should be relatively stable as long as FRAX remains successfully pegged to the US Dollar. Its emergence as a top-three traded pair this quarter reflects this stability while other volatile pools saw their trading volume sink. In total, trading activity in Q1 rose 6.9% for the most recent quarter after increasing 243.1% in Q4 2021.
Another factor adding to increased trading was chatter of a pending airdrop. The airdrop is for the upcoming FPI token. A snapshot was taken on February 20th of FXS of those who staked FXS tokens or were LPs of the FXS/FRAX pool. Those who heard about airdrop eligibility might have contributed to market activity by trading for FXS tokens or contributing to the liquidity pool.
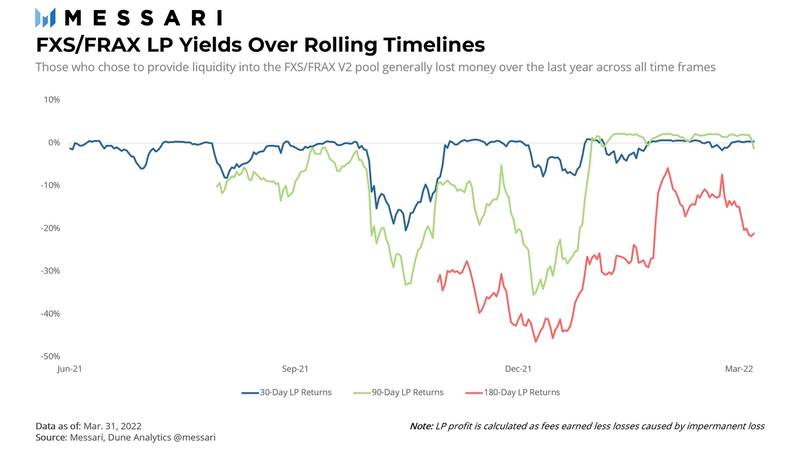
Unfortunately for LPs, the FXS/FRAX pool suffers mixed results. Trading fees were not strong prior to the implementation of FXS1559 while the token’s price fluctuated wildly. The combination resulted in heavy losses across all three rolling time frames. Once the buyback program was initiated, trading volume picked up substantially. Though FXS price volatility didn’t go away, the additional trading fees earned by LPs began to counteract impermanent loss, turning total LP fees positive.
SAITAMA/WETH
Last quarter, we described the rise of SAITAMA/WETH as a beneficiary of the November 2021 trading surge. After all, SAITAMA, as we noted, is the token for another of the doge-like projects that were so popular among retail investors, but its continued success has subverted expectations.
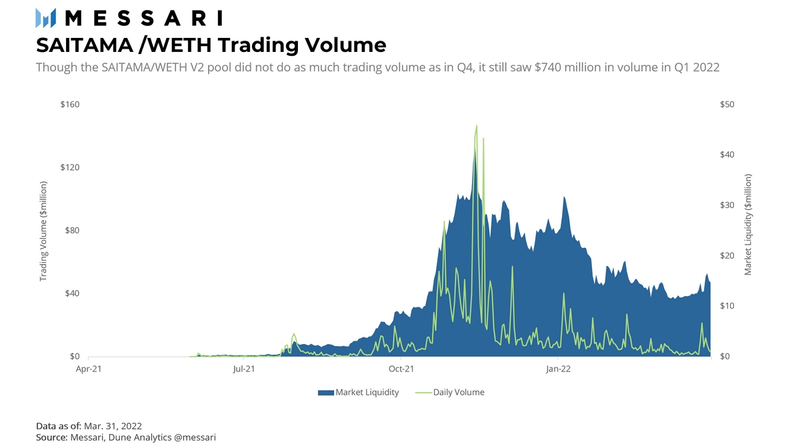
Not only was SAITAMA/WETH a top-performing market in Q4 2021, it continued to be so for Q1 2022. That said, the asset pair did see overall trading volume fall 67.6% from the previous quarter. The trading volume growth of the previous quarters could not be sustained after a 2,500%+ increase in Q3 and a 700%+ increase in Q4. This highlights the broader trend of retail trading in the crypto markets: H2 2021, and Q4 2021 in particular, were very strong for memecoins and the general market, while Q1 2022 experienced a pullback.
Market liquidity for SAITAMA/WETH fell almost 40% from the previous quarter. Yet this decline still is less than the decline in trading volume. This all occurred while the price of SAITAMA fell by more than 75% over the quarter. LPs that kept their capital in the pool could have done so for many reasons, including the possibility of high fees or forgetting to close their market-making position.
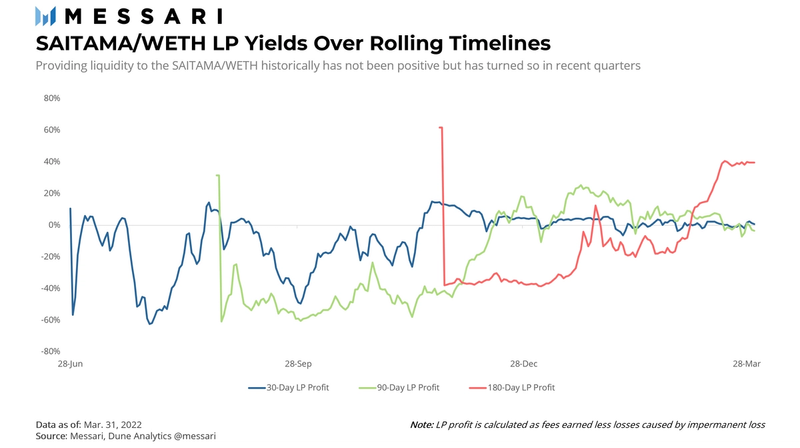
LPs who contributed liquidity to the SAITAMA/WETH pool saw a mix of positive and negative yields throughout the rolling 30-, 90-, and 180-day time frames. In line with expectations, most of the positive returns came in or after Q4 2021 when the trading volume began to pick up. Roughly 66%, or 62 out of 90 days in the quarter, led to positive returns for LPs over the 30-day time frame. The number of positive days increased to 82% for anyone supplying liquidity over a 90-day period but decreased to 32% for 180-day LPs, respectively.
Top V3 Markets
Unsurprisingly, the most active V3 markets are the USDC/WETH, USDC/USDT, and WBTC/WETH markets, which contributed 61.0% of V3 volume. Each market sheds a unique light on a different part of the crypto ecosystem: 1) ETH activity, the cornerstone of smart contract networks; 2) stablecoin markets, and 3) the relationship between the two largest crypto assets.
USDC/WETH
The USDC/WETH market is the predominant blue-chip stablecoin/ETH pair and the best indicator for ETH trading activity. It’s worth noting that the USDT/WETH pair is also very active on Uniswap. In fact, it is the second most actively traded market. Demand for these three tokens is particularly high on Uniswap as most trades are denominated in those assets, which makes those markets the central routing point for market activity.
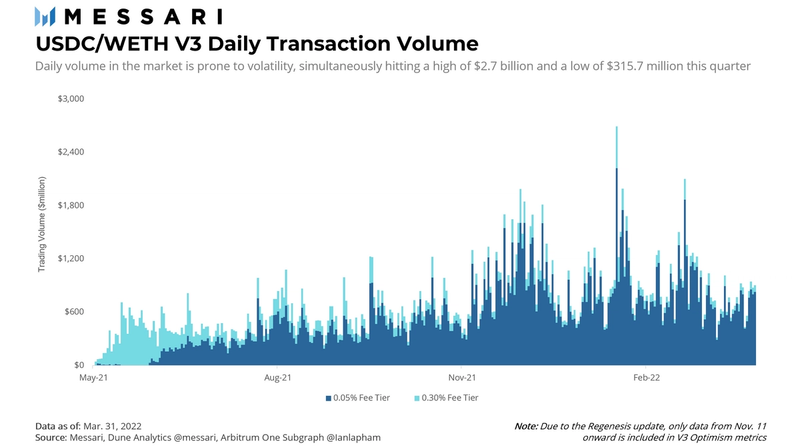
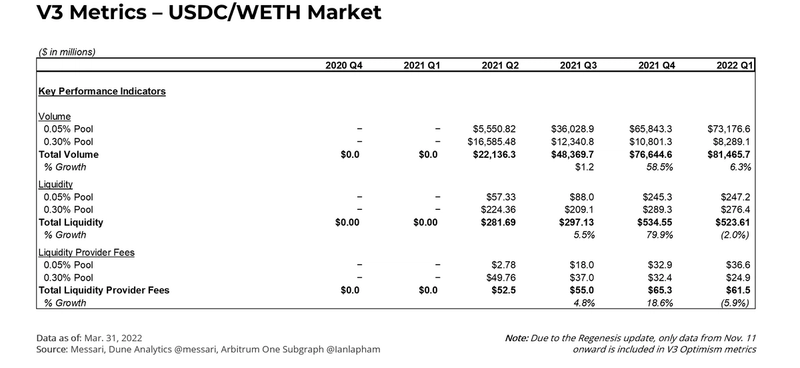
Total USDC/WETH V3 transaction volume for Q1 2022 amounted to $81.5 billion, an increase of 6.3% from the previous quarter. The majority of the increase came from the 0.05% fee tier, which jumped from $65.8 billion to $73.2 billion. The increase was partially negated by the decline in trading in the higher 0.30% tier. This trend highlights how competitive exchanges are. As noted in the Q4 2021 iteration of this report, capital competes with capital for fees and ultimately drives trades towards lower fee tiers.
Dividing the total fees by each dollar of liquidity highlights the yields an LP can expect to earn. A quick, high-level comparison of return on assets between the USDC/WETH V2 and V3 pools shows how much more capital efficient V3 is. V2 returns $0.04 for each dollar deposited, or 4.0%; the same calculation for V3 returns $0.12 for every dollar, or 12%. Note this doesn’t account for each V3 LP’s concentrated liquidity, but holistically summarizes V3’s ability to generate a 3x higher return on its liquidity.
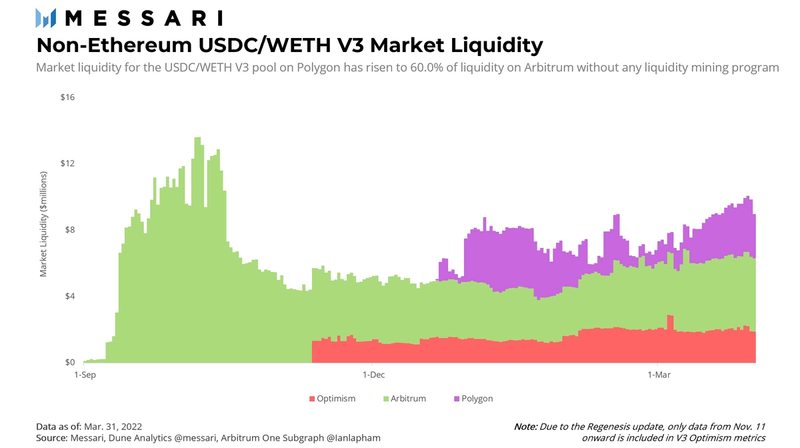
Although Polygon found plenty of success in Q1, Arbitrum has a significant amount of liquidity available for USDC/WETH V3. Arbitrum has $16.2 million, i.e., 28.3% more liquidity than Polygon at $12.6 million. Because Arbitrum has been around longer, Polygon’s liquidity has recently grown at a faster daily rate — and it will be supercharged even more with Polygon’s liquidity mining program going live next quarter.
USDC/USDT
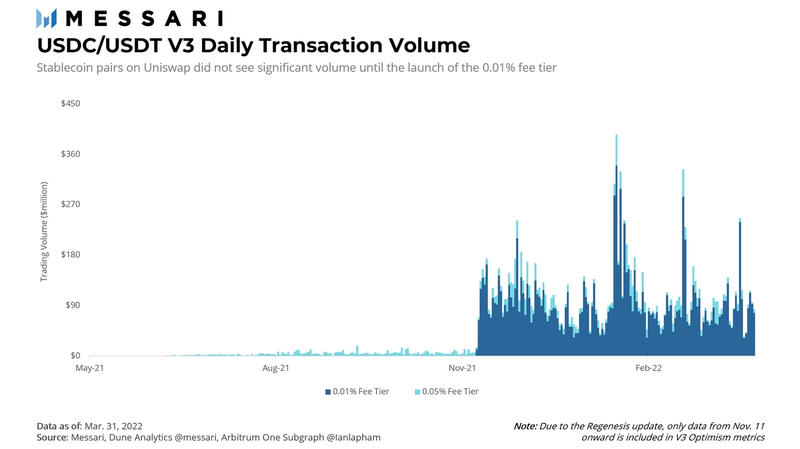
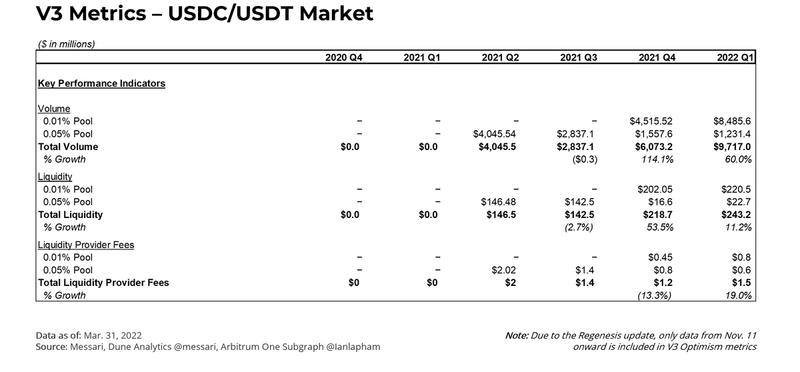
Uniswap was not competitive in the stablecoin DEX market until the implementation of its 0.01% trading fee tier. Once that became active, Uniswap could draw the attention of traders looking to pay the cheapest fees on highly correlated stablecoin pairs. The visual above clearly shows when that occurred.
Stablecoin trades in the USDC/USDT market jumped 60% overall against Q4 2021. This followed a 114.1% increase compared to Q3, more than tripling in nine months. Unsurprisingly, 87.3% of trading volume, or about $8.5 billion, came from the lower 0.01% fee tier. Liquidity, meanwhile, only increased 11.2% over the quarter.
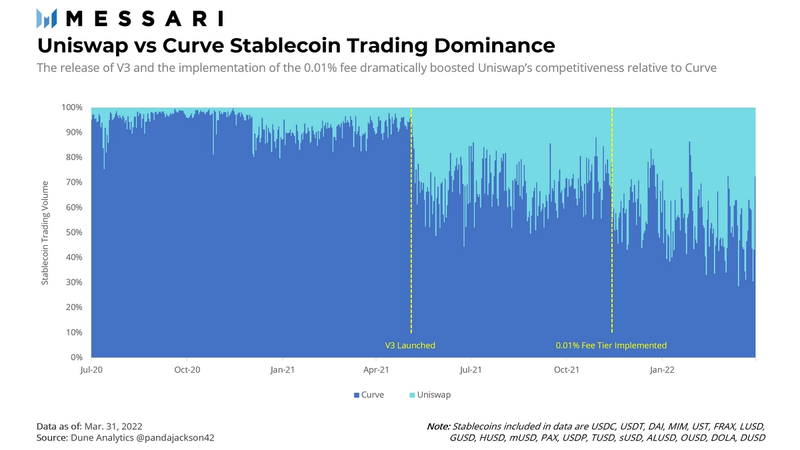
In last quarter’s report, we wrote about Uniswap’s decision to implement the 0.01% fee tier as a boost for stablecoin trading volume. Analyzing the data above, Uniswap does appear to now be more competitive with Curve as a result of its enhanced capital efficiency.
Prior to the launch of V3, Uniswap was doing a median of 8.54% of the combined volume between Uniswap and Curve. After the launch of V3, but prior to the implementation of the 0.01% fee tier, Uniswap stablecoin trading across both V2 and V3 operated at a median of 30–33% trading dominance. That median ratio now stands at 48.3% today, practically on parity with Curve. Uniswap’s share of the two combined DEX’s volume even reached a high of 71.4% on one day. Given the importance of stablecoins in the DeFi ecosystem, Uniswap’s gains in this area are exciting to watch.
WBTC/WETH
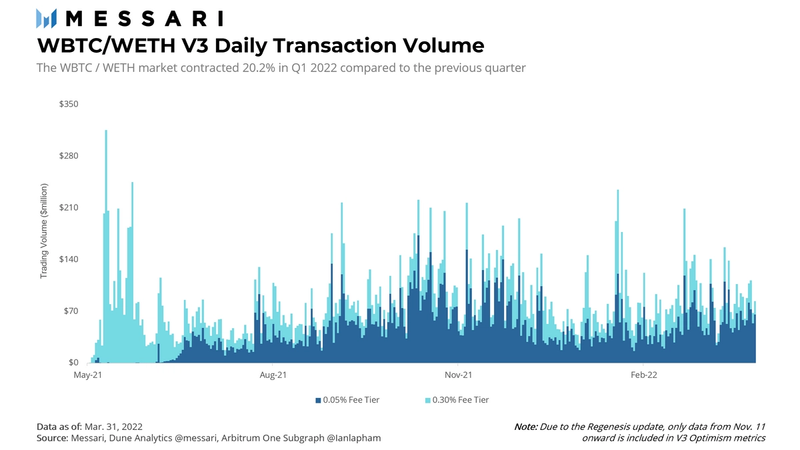
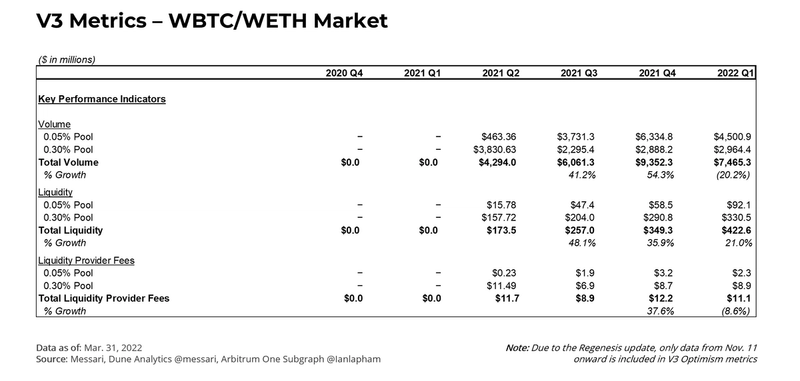
Trading volume of the WBTC/WETH V3 pool fell 20.2% compared to Q4 2021. Notably, volume in the 0.05% pool fell 28.9% while volume in the higher 0.30% fee tier was mostly consistent across quarters. Liquidity in the smaller fee tier did jump 57.3% whereas the higher fee tier only moved up 13.7%. Since investor sentiment has noticeably cooled, some investors might be choosing to take a yield-generating LP position, earn fees on these (more stable) blue-chip assets, and re-evaluate the state of the market when better opportunities arise.
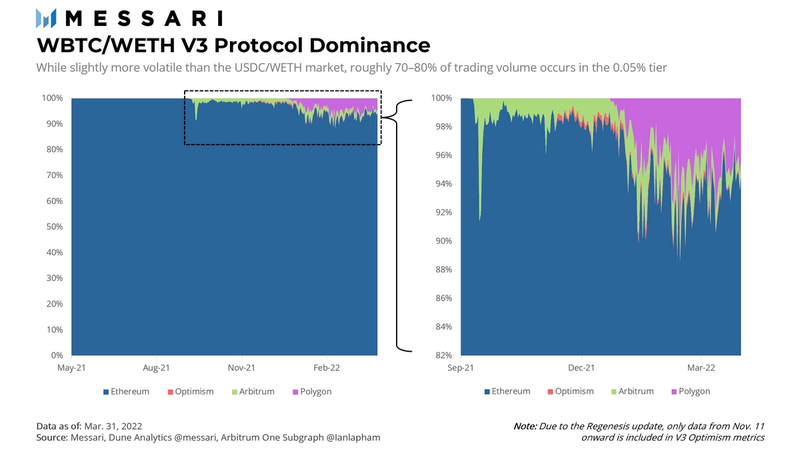
Behind the scenes, Ethereum continues to show signs of losing its complete dominance of V3 trading. Over the last four quarters, the share of transaction activity occurring on Ethereum has gone from 100.0%, to 99.8%, to 98.4%, and finally, 96.4% in Q1 2022. Once again, the emergent winner in Q1 2022 continues to be Polygon. The WBTC/WETH protocol dominance level for Polygon shows the network starting at around 5% of all trading activity and peaking to 10% midway through the quarter. In total, the 3.6% gain by Polygon and other blockchains isn’t earth-shattering, but it will be something to track as users continue to move towards cheaper scaling solutions.
Grant Program
Uniswap approves grants almost every week, but to avoid publishing a blog post for each new funding, grants are batched together into waves. In Q1 2022, Uniswap released Wave 6 and Wave 7 of their Uniswap Grants Program. Note, the quarter in which batches become publicly shared does not necessarily correlate with the quarter they were made (i.e., some grants from the batches may have been funded in Q4 2021).
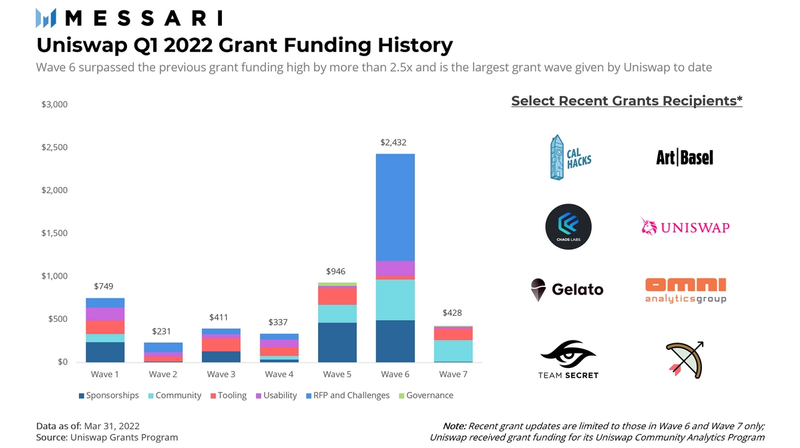
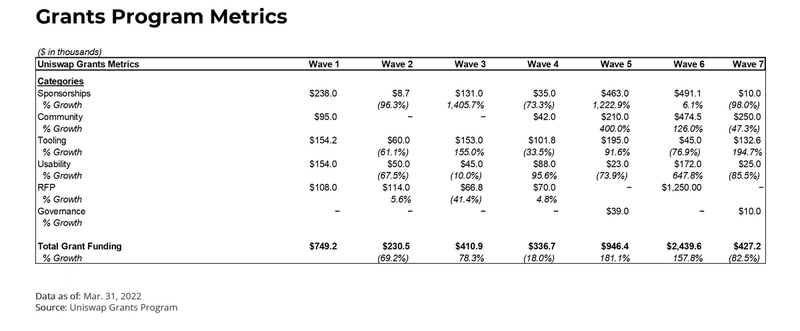
What stands out from the quarter is the total grant funding distributed in Wave 6. The previous high occurred in Wave 5 with $946,000. Wave 6 was more than a 2.5x increase from this level, equating to $2.4 million of funding. More than $1 million was dedicated to the “RFP and Challenge” category. Some of the most notable grants from Wave 6 and Wave 7 are below:
Other Internet (Governance Experiments) –$1,000,000
Other Internet received a $1 million grant from Uniswap Grants Program to further their research of Uniswap’s open governance. In the summer of 2021, Other Internet completed initial research on the off-chain governance occurring in the protocol’s Discord channels. The additional funding will support a series of action-oriented proposals to strengthen governance practices, many of which will ideally be implemented throughout crypto. Specific deliverables include a redesign of the governance process, a new committee for UGP, and insights into the protocol treasury. Money from this grant is expected to last the upcoming year.
Unigrants Community Analytics Program – $250,000
A quarter of a million dollars was set aside to fund winners of a new analytics-focused program. The objective of the program is to reward UNI token bounties to contributors who could produce analytics for the protocol. The purpose of the program is to use these analytics to further onboard new users into the community. A committee of five individuals, ranging from UGP members to independent analysts, were chosen to review applications and select bounty winners. More information about the Community Analytics Program can be found in the next section.
Team Secret – $112,500
Uniswap Grants Program decided to continue its partnership with Team Secret for the first half of the fiscal year 2022 after the team’s top-three finish at The International, the biggest global DOTA tournament. As announced in June 2021, the partnership includes the team creating educational content around Uniswap and organizing future technology launches. The goal was — and continues to be — aimed toward reaching new audiences, especially those in the digitally native gaming community.
Art Basel (Crypto Onboarding) – $68,500
Funding was provided to set up a crypto booth at the upcoming Art Basel in December 2021. Occurring in Miami, the booth was dedicated to helping event attendees get onboarded with crypto. People were around to assist curious participants on setting up their first wallet, claiming their first event POAP, learning how to get into NFTs, and more. The end result saw over 300 people get onboarded into crypto and the DeFi ecosystem.
Community Analytics Program
As stated prior, the Community Analytics program is designed to encourage more analytics for the growth of the Uniswap community. Multiple rounds of bounties have already occurred from the time the grant was approved till the end of Q1 2022.
- Bounty #1: Uniswap on Polygon — Compare the deployment of Uniswap V3 to Polygon with its metrics on Ethereum. Include other DEXs in the analysis. The final product should display growth in a clean dashboard.
- Bounty #2: Uniswap V3 LP Behavior — Create a dashboard analyzing LP behavior for Uniswap V3. Given the capital efficiency of the product, Uniswap wanted to better understand the fee tier, volume, and liquidity preferences of LPs.
- Bounty #3: Uniswap V2 vs. V3 (L1) – Over any select time frame, provide analytics highlighting key metrics between the use of V2 compared to V3. V3 KPIs should be broken out by Layer-1 so Uniswap can better understand the drivers behind the adoption of its markets.
- Bounty #4: Uniswap Governance – Study points of decentralization for Uniswap Governance, including all off-chain and on-chain voting procedures. This bounty was earned by selecting three specific data points and conducting an analysis of all relevant governance factors.
The Community Analytics Program will continue with Round 3, which is currently taking place. Submissions were due on April 1st, 2022. Winners will be announced one week later on April 8th.
Governance Updates
Feb. 14, 2022 — Deploy Uniswap V3 on Harmony [Failed]
The decision to approve Hermes DeFi with a Uniswap V3 codebase use grant was rejected for not meeting quorum. The proposed idea would have allowed another alternative DEX to use Uniswap’s code to create an AMM on Harmony. Uniswap would, in turn, receive a plethora of benefits, including Hermes token ownership, trading fees, a perpetual trading pool on the AMM, and more. The community’s concerns centered on how this would not have been a native Uniswap app launch, compared to other “Deploy Uniswap to XYZ Blockchain” proposals. Since sentiment was mostly positive, however, the decision to launch on Harmony — either through a third party or natively — might potentially be revisited if a quorum can be met.
Feb. 21, 2022 — Fund the Fee Switch Activation [Failed]
Uniswap’s fee switch mechanism is a known topic of debate. At the heart of the question is when and how Uniswap will activate its famous fee switch to distribute protocol revenue to UNI token holders. This proposal offered to create a fund to oversee the application of the fee switch mechanism for both V2 and V3 pools but was rejected by the community.
March 12, 2022 — Provide Voltz with Uniswap V3 Additional Use Grant
Proposed back in Q4, the decision to provide Voltz Protocol with the codebase use grant was successfully executed in March 2022. The codebase granted in this vote will be used for Voltz’s new DeFi primitive for the trading of leveraged interest rate swaps. In return for approving this governance measure, Voltz has agreed to offer 1% of its token supply to Uniswap; if the protocol is successful in attracting liquidity, both Uniswap and Voltz stand to benefit.
March 19, 2022 — Deploy Uniswap V3 on Celo
A temperature check gauging interest in deploying V3 on the mobile-first, environment-focused Celo blockchain was passed in March 2022. Included in the proposal, if ultimately passed, will be $10 million in financial incentives, a third of which would be set aside for environmentally friendly assets such as tokenized carbon credits. By approving the temperature check, Uniswap and the Celo Foundation hope to move to a final vote shortly.
March 25, 2022 — Deploy Uniswap to Gnosis Chain
The community voted to pass another temperature check regarding the deployment of Uniswap V3 to Gnosis Chain. Gnosis Chain recently underwent a rebranding effort from xDai Chain in an effort to grow usage of the network. Part of this proposal would include funding from the Gnosis Chain team in the form of $10 million from the Gnosis DAO ecosystem fund. Money received from the DAO will be allocated for a tailored liquidity mining program intended to attract users. A final vote should follow a similar timetable as the one needed to approve V3’s launch on Celo.
Final Thoughts
Uniswap’s first quarter of 2022 was primarily marked by organic growth on the Polygon network, exploring ways to expand V3 to other networks, and the pullback of overall trading across the larger crypto market. That last point is what community members may find concerning: if less trading activity occurs, won’t that be detrimental to Uniswap?
The answer is a combination of yes and no. Exchanges always want to see healthy trading volume but the reality is Uniswap is well-positioned to deal with any correction in crypto markets. The fact users can enter into LP positions and earn yields suggests an engagement with the protocol will continue. Tracking how the protocol responds to a changing macro investment environment will be at top of mind for the rest of the year.
This report was commissioned by Uniswap Labs, a member of Protocol Services. All content was produced independently by the author(s) and does not necessarily reflect the opinions of Messari, Inc. or the organization that requested the report. Paid membership in Protocol Services does not influence editorial decisions or content. Author(s) may hold cryptocurrencies named in this report.
Crypto projects can commission independent research through Protocol Services. For more details or to join the program, contact ps@messari.io.
This report is meant for informational purposes only. It is not meant to serve as investment advice. You should conduct your own research, and consult an independent financial, tax, or legal advisor before making any investment decisions. The past performance of any asset is not indicative of future results. Please see our terms of use for more information.
Appendix
