Bitcoin price Analyses
Bitcoin’s price closed in red figures for the third time over the last four days on Sunday and concluded its daily session -$701.10.
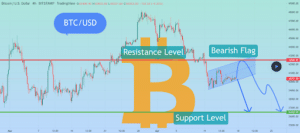
The first chart we’re analyzing today is the BTC/USD 4HR chart below from Michael_Winner. BTC’s price is trading within a large bearish flag, at the time of writing.
If bullish BTC market participants lose the current trend line to the downside, the next major support for bullish traders on the 4HR timescale is $36,5k.
Bitcoin bulls also have overhead resistance at the $42,5k level that if overcome could at least in the short-term stall bearish momentum.

The Fear and Greed Index is 24 Extreme Fear and is -4 from Sunday’s reading of 28 Fear.
Bitcoin’s Moving Averages: 5-Day [$40,190.95], 20-Day [$43,630.92], 50-Day [$42,040.75], 100-Day [$43,726.13], 200-Day [$46,667.77], Year to Date [$41,557.30].
BTC’s 24 hour price range is $39,659-$40,593 and its 7 day price range is $39,445-$42,349. Bitcoin’s 52 week price range is $29,341-$69,044.
The price of bitcoin on this date last year was $60,273.
The average price of BTC for the last 30 days is $43,312.
Bitcoin’s price [-1.74%] closed its daily candle worth $39,707.6 and is -3% for the last 30 days.
Ethereum price Analyses
Ether’s price didn’t experience much volatility over the Easter weekend and finished Sunday’s daily session -$69.63 and back below the $3k level.
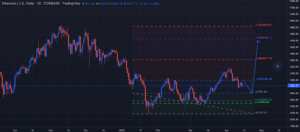
The second chart we’re looking at today is the ETH/USD 1D chart below by abumartino1. ETH’s price is trading between the 1 fibonacci level [$2,799.48] and 1.618 [$3,188.18], at the time of writing.
The targets for bullish ETH traders to the upside are 1.618, 2.618 [$3,817.15], 3.618 [$4,446.11], and 4.236 [$4,834.81].
Bearish Ether traders have a primary target of the 1 fib level with a secondary target of 0.618 [$2,559.22]. If they’re successful at 0.618 the third target to the downside of the chart is 0.5 [$2,485.00] and the fourth target is 0.5 [$2,485.00].

Ether’s Moving Averages: 5-Day [$3,026.26], 20-Day [$3,195.28], 50-Day [$2,964.28], 100-Day [$3,256.93], 200-Day [$3,327.90], Year to Date [$2,977.37].
ETH’s 24 hour price range is $2,988-$3,077 and its 7 day price range is $2,967-$3,206. Ether’s 52 week price range is $1,719-$4,878.
The price of ETH on this date in 2021 was $2,345.
The average price of ETH for the last 30 days is $3,163.
Ether’s price [-2.28%] closed its daily session on Sunday worth $2,989.19 and in red figures for the first time in three days.
Chainlink price Analyses
Chainlink’s price sold-off lower on Sunday with the majority of the market and concluded the day -$0.41.
The LINK/USD 1W chart below from Sporia shows LINK’s price trading inside a descending triangle.
The target for a potential pattern completion zone and maybe the most probable bottom for LINK’s price in a bear market is between $7.29 and $9.5.
Chainlink’s price is -66.3% against The U.S. Dollar for the last 12 months, -49.27% against BTC, and -73.64% against ETH over the same duration, at the time of writing.
Chainlink’s Moving Averages: 5-Day [$13.84], 20-Day [$15.68], 50-Day [$15.26], 100-Day [$18.10], 200-Day [$22.04], Year to Date [$17.11].
Chainlink’s 24 hour price range is $13.73-$14.6 and its 7 day price range is $13.43-$15.16. LINK’s 52 week price range is $11.42-$52.7.
Chainlink’s price on this date last year was $40.07.
The average price of LINK over the last 30 days is $15.60.
Chainlink’s price [-2.90%] closed its daily session worth $13.73 and in red figures on Sunday for the first time in three daily candle closes.
The post Bitcoin, Ethereum, Chainlink Price Analyses appeared first on The Cryptonomist.


