
In the last two years, the historical period full of complications and highly unexpected, undermined the approach to mass adoption of Bitcoin. Its popularity was generated especially by the assiduous research carried out by investors for a high performing asset.
How the general context influenced the mass adoption of Bitcoin
Covid-19 has brought to light how the current capitalist economy is inefficient for individuals, but very efficient only for firms willing to operate via debts.
Inflation has reached levels not seen since the ’70 (8.5% – March 2022 Figure) and this has shook the entire global economic system. Big investors and funds, mostly institutions, had to find solutions in order to avoid capital depreciation throughout time, looking for low cap assets and consequently very volatile.
This has caused a dump in treasury yields, considered safe investment choices, and it has led investors to opt for risky assets as the cost of opportunity moved towards the increase of the risk premium, and due to wealth creation principles, it has favoured securities such as stock market indices, global equities and cryptoassets, which offered higher returns compared to the initial risk.
Sustaining the configuration of cryptoassets as high risk instruments there is the correlation between US equities and Bitcoin, highlighted by the correlation coefficient.
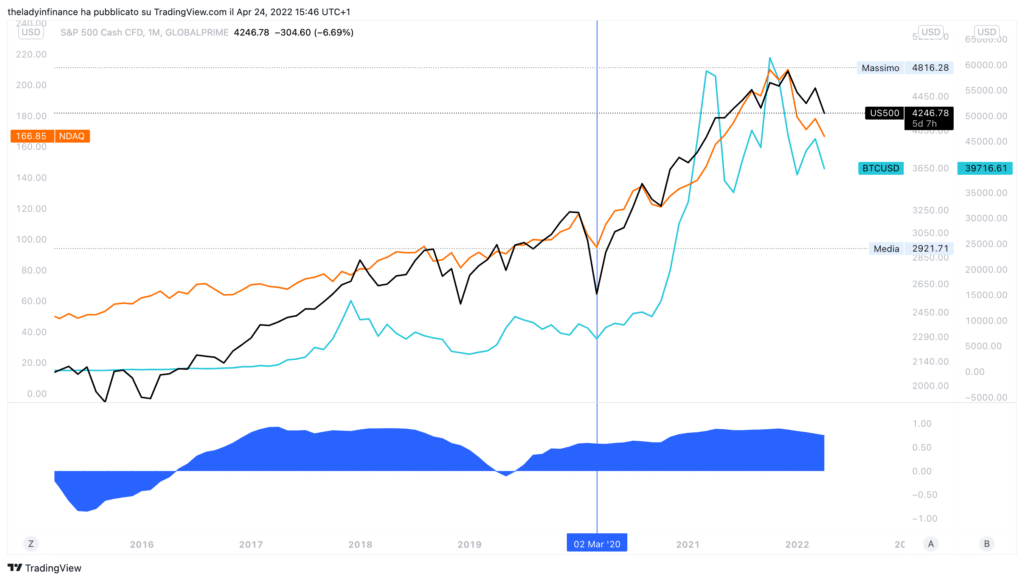
Due to the aforementioned situation, Bitcoin from the 13th March 2020 (starting point for th
This whole increase, named “rally of everything” by mainstream media, was generated because of the cost of capital reaching zero or negative territory due to the strong accommodative monetary policies brought forward by G20 Central Banks.
Many market analysts constantly look for comparisons to previous cycles in order to understand how Bitcoin might perform in the future. We ought to stress out though that there is a factor little known but fundamental to understand that the current cycle is totally different from the previous ones.
The new Bitcoin cycle
Indeed in the last two years, the interest for derivatives instruments increased along with the use of leverage (which is an instrument that allows traders to get loans from the providers’ credit line, in exchange for less capital being used by traders for their positions, and consequently to generate bigger profits or losses).
We must also highlight a contradiction in the financial system: Bitcoin is an unregulated asset, although its derivatives instrument are (i.e CME futures and options, Futures ETFs).
Financial institutions are not allowed to operate with unregulated assets, therefore their market exposure is merely on derivatives, not on the asset itself.
This consideration totally changes the market vision on Bitcoin, and it serves as a key to further understand the strong imbalance of orders that came up between 10k and 65k, and also to understand future price movements.
In order to better understand this concept we firstly need to divide these derivatives in 2 macroareas:
- Futures
- Options
In this article we will cover both.
Future
There are mainly two macroareas in which futures are divided into:
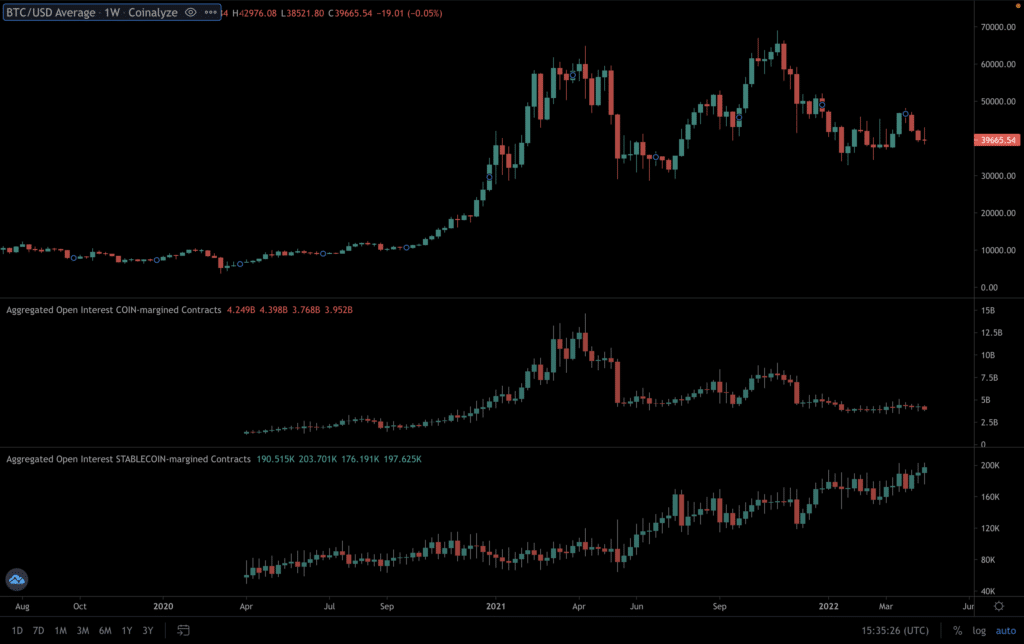
- Coin-margin: uses cryptoasses as collateral for operativity and profits and losses are accrued in cryptos.
- Stable – margin: uses stablecoins as collateral for operativity and profit and losses are accrued in stablecoins (mainly in USDT).
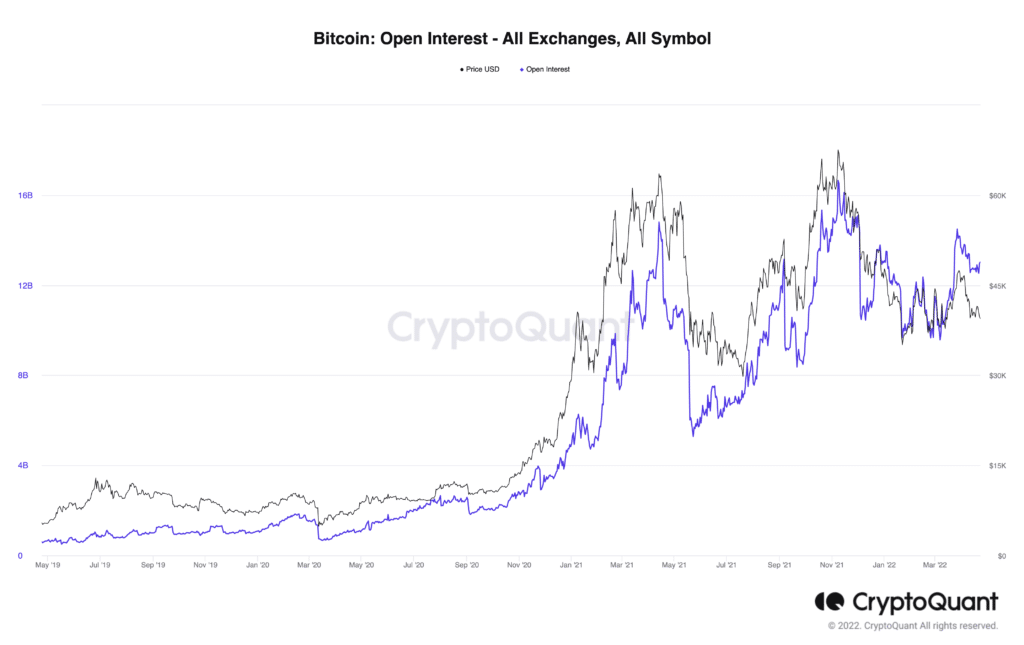
To further understand the scope of this discussion we must start from the Open Interest chart (numbers of open contracts).
The first noticeable thing is the strong correlation between the number of open contracts and Bitcoin’s price.
In spite of the Open Interest increase, the number of Bitcoins on derivatives exchanges has decreased from March 2020
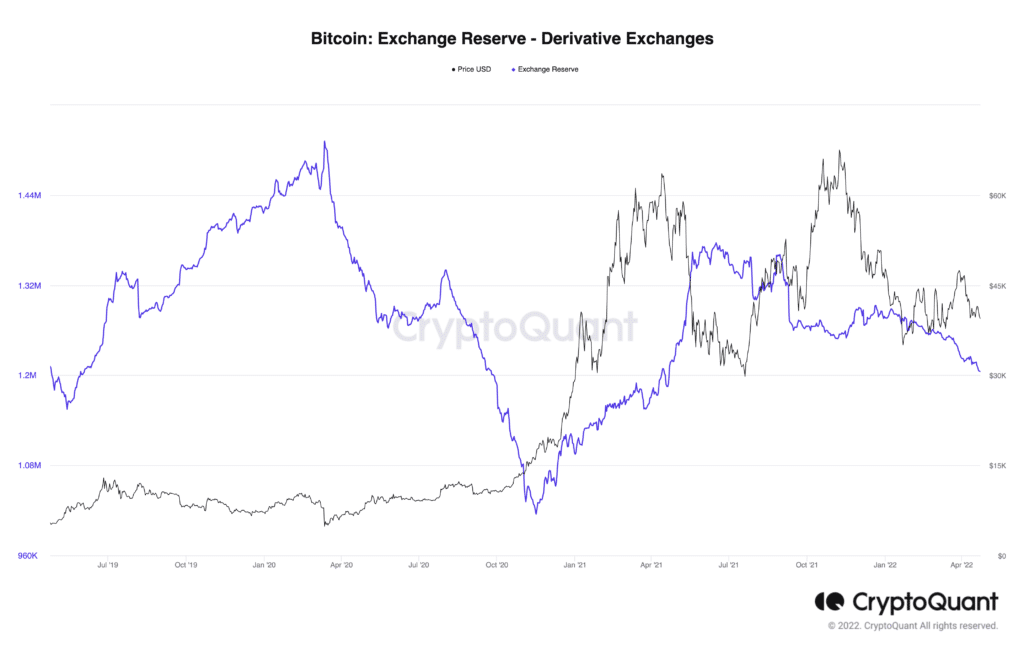
Implicitly, this shows that the ones managing derivatives capitals is the “smart money”.
The most interesting thing comes from May’s dump, where the coin margin, needed for organic growth of the asset itself, collapsed to very low levels, compared to those of Tether which continued to increase.
In addition to the strong increase of the Open Interest also the leverage ratio (which shows the ratio between Open Interest and the numbers of coins on Exchanges) has increased, this means that a higher use of leverage is in play.
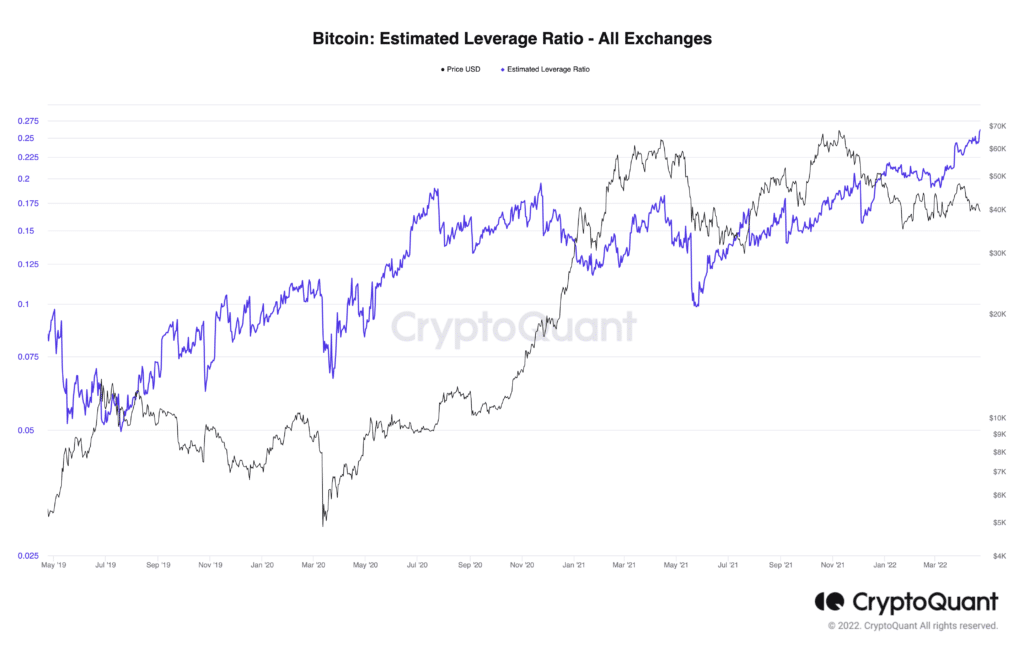
On the technical side, previous data have shown that in the most recent times, in order to understand price movements, it is more helpful looking at derivatives data rather than spot market ones, even though within futures data we have to highlight which ones we need to focus more on.
Looking at Tether reserves on Exchanges is very easy to notice the abysmal difference between Derivatives Exchange volumes and Spot Exchanges volumes.
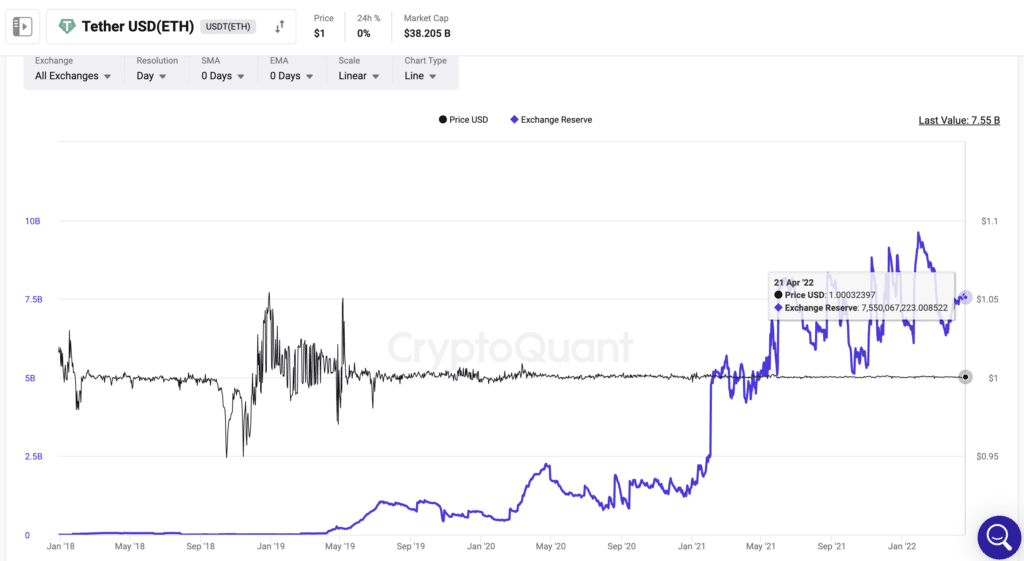
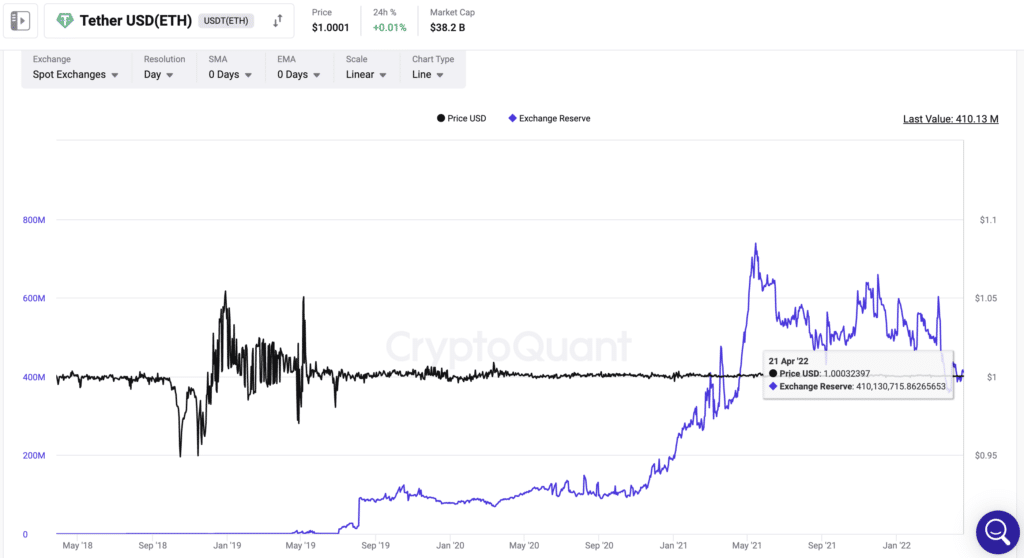
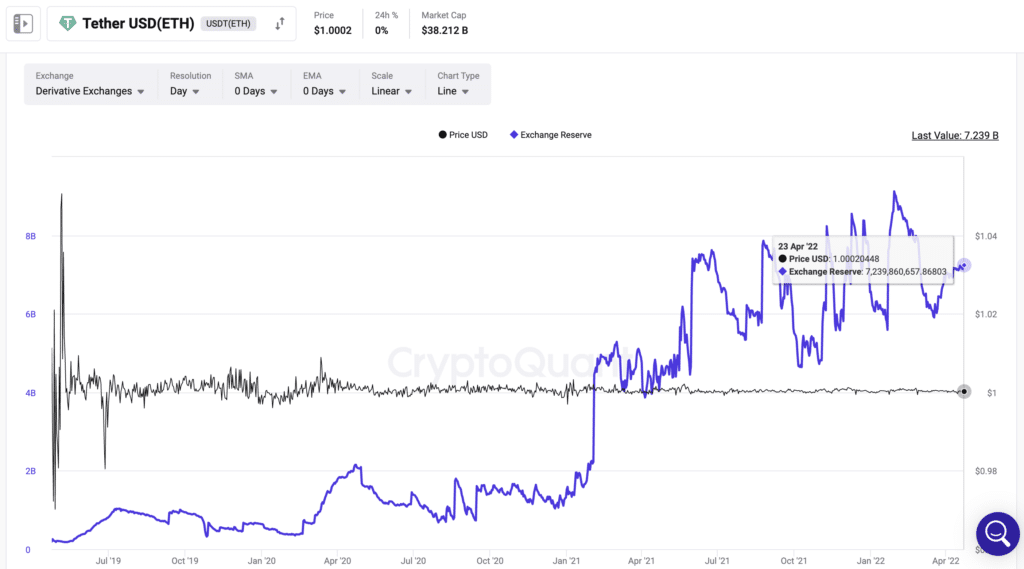
We also need to stress, as mentioned before, that big Financial Institutions, who manage big capitals, can only access certain types of regulated financial derivatives, such as CME, which shows the biggest trading volumes.
It is very important indeed keeping track of capital fluxes which got into the market via these, as institutional liquidity comes second only to the Whales.

This chart shows the daily volume on CME future contracts along with their Open Interest.

Here is the chart showing the Monthly Turnover of CME future contracts, and we might notice that it reaches figures between 90bln and 100bln a month,
Options
Another instrument, little known among retailers but very used by institutional, that allows to speculate are options
Differently from futures they have a lower volume (see picture below), as they are widely use for capital protection for various reasons, such as hedging.
The highest volume of trading is on Deribit, which is used mostly by whales and hedge funds, whereas regulated institutional parts use CMEs, despite their low volume.


The peculiarity of options is represented by their delta; this is one of the 4 main indicators gauging intrinsic risks for option traders: specifically their exposure to volatility of price fluctuations between spot price and option contract price.
BTC options are mostly out of the money, meaning their contract prices are higher for buy calls and lower for sell puts, presenting a statistical disadvantage if used incorrectly. This is the reason for low trading volume on options.
Indeed, as said before, they are used mostly as hedging instruments to cover the underlying asset volatility or for arbitrage strategies.
If we sum up options’ trading volume to the futures trading volume we will get a stunning multibillion figure, which goes well beyond spot market’s volume: this is due to the spot market volume of Bitcoin being a mere 50bln dollars.
Spot trading volume can be calculated approximately based on reserves on exchanges and Bitcoin’s average price in the last 90 days. There is no leverage on it. Bitcoins outside exchanges should not be taken into the calculation as they cannot not exercise selling pressure, unless they are deposited on Exchanges.
On the other hand, the counter value of dollars on derivatives market, which hovers around 50bln dollars, is higher due to these factors because there is the possibility of using the following tools in order to manipulate the price:
-
- Leverage (up to 125x)
- Stablecoins
In conclusion, looking only to spot market fluctuations, leaving out institutional operativity, still believing that we reached high prices in the last year and half due to mass adoption, is actually a pretty wrong statement.
Valentina Marzioni – Theladyinfinance
Simone Eremitaggio
The post Bitcoin, mass adoption or mere speculation? appeared first on The Cryptonomist.


