April was a bloody month for crypto, and especially for Ethereum. The ETH price fell from its month’s highest level at $3580 to $2700 last night. Can we expect May to perform better?
Technical Analysis
Technical Analysis By Grizzly
The Daily Chart
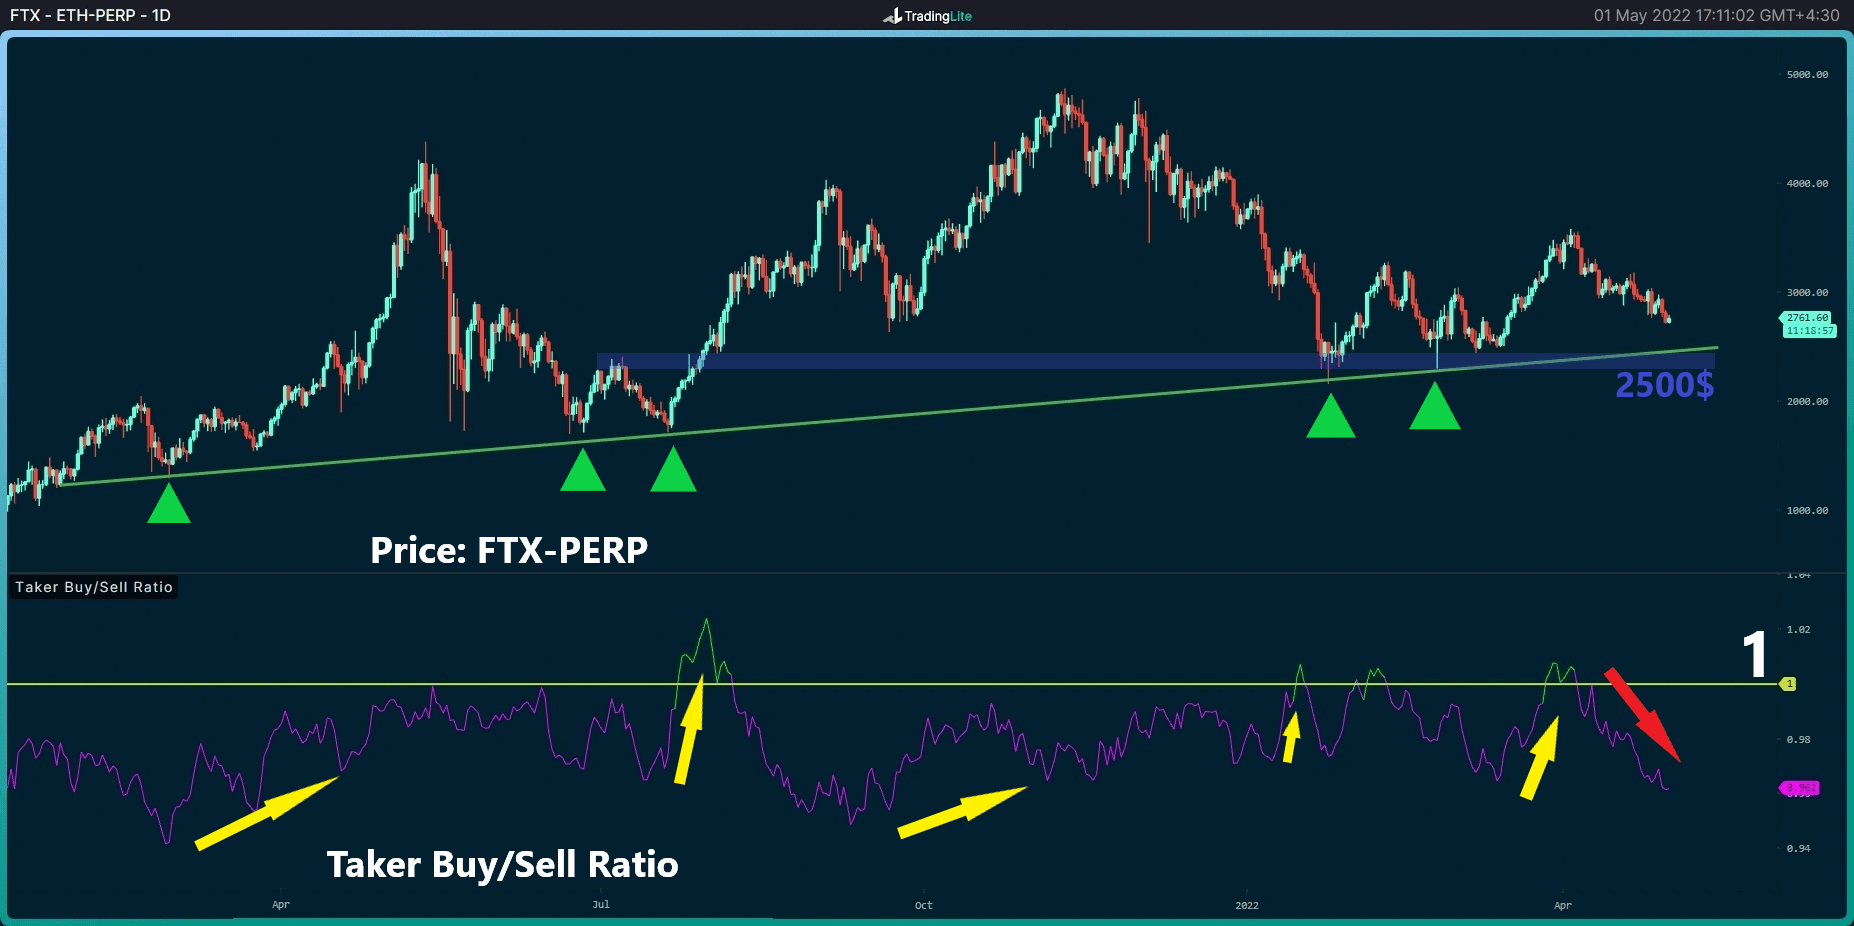
The following chart shows perpetuals’ exchange data from FTX. ETH is trading on top of the marked long-term ascending line (in green).
This trend line has provided support to the price since January 2021, based on the previous five attempts. ETH saw a bullish leg following each of these attempts.
Currently, ETH is heading towards the sixth attempt on top of the line, along with the blue horizontal level, which intersects with the dynamic trend line at $2,500. A breakdown could be catastrophic for ETH.
One thing to note is that buyer takers are less dominant, as evident by looking at data from Binance. Past uptrends have been accompanied by increased buyer dominance, which is marked on the chart below in yellow. Unfortunately, there is no positive signal now.
Key Support Levels: $2800 , $2500 , $2300
Key Resistance Levels: $3000 , $3300
Moving Averages:
MA20: $2961
MA50: $3052
MA100: $2901
MA200: $3456
The 4-Hour Chart
On the 4-hour timeframe, the Fibonacci Retracement level at 0.786 provided support and has so far prevented ETH from breaking down.
On the other hand, the Fibonacci level at 0.618 also acts as a solid resistance level, currently around $2900. Suppose ETH can break out above the marked falling wedge (in blue), it can signal a reversal in the short term. If a higher high at $3,000 is formed, this can enhance the bullish sentiment.
On-chain Analysis
Number of Active Addresses (14d Moving Average)
Definition: The number of unique addresses active in the network, either sender address or receiver. Only addresses that were active in confirmed transactions are counted.
This metric usually accompanies price trends and can be considered an index of the network’s health. When the price moves upwards, we can expect an increase in the number of transactions on the network, which increases the number of active addresses. This metric has been under a downward trend and has reached the lowest level after recording its all-time high in November.


