Bitcoin Analysis
Bitcoin’s price hasn’t seen negative momentum on the daily RSI since May 19th but is still stuck in a range between $28k-$32k. BTC’s price concluded Wednesday’s daily session -$919 as bulls again were denied access above the $32k level.
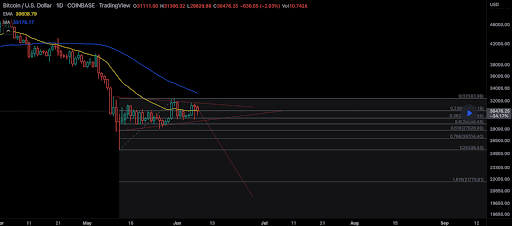
The first chart we’re analyzing for Thursday is the BTC/USD 1D chart below from BGMind_Control. BTC’s price is trading between 0.382 [$29,496.85] and 0.236 [$30,562.19], at the time of writing.
The primary overhead target for bullish BTC traders is 0.236 with a secondary target in the interim of 0 [$30,383.96].
Conversely, the targets to the downside on BTC on the daily time frame are the 0.382 fib level, 0.5 [$28645.45], and 0.618 [$27,828.06].

Bitcoin’s Moving Averages: 5-Day [$30,644.85], 20-Day [$29,969.16], 50-Day [$35,857.38], 100-Day [$38,332.57], 200-Day [$45,244.26], Year to Date [$38,888.27].
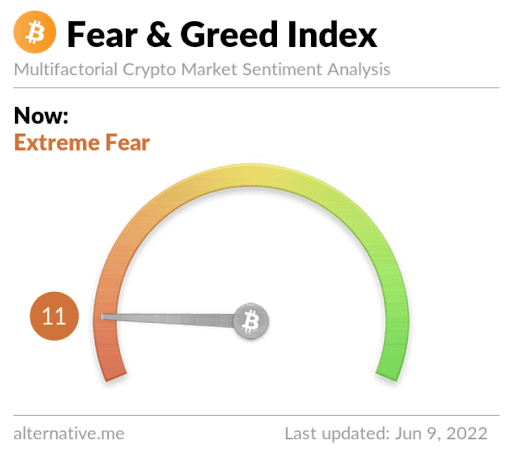
The Fear and Greed Index is 11 Extreme Fear and is -6 from Wednesday’s reading of 17 Extreme Fear.

BTC’s 24 hour price range is $29,975-$31,522 and its 7 day price range is $29,419-$31,565. Bitcoin’s 52 week price range is $26,600-$69,044.
The price of Bitcoin on this date last year was $37,347.
The average price of BTC for the last 30 days is $30,107.2 and its -14.1% over the same duration.
Bitcoin’s price [-2.95%] closed its daily candle worth $30,230 on Wednesday and finished in red figures for a second straight day.
Ethereum Analysis
Ether’s price finished its daily candle on Wednesday down more than 1% and -$19.98.
Ether bulls are eager for The Merge to occur over the next few months when Ethereum will move from a PoW blockchain to PoS – but will this event be enough to reverse ETH’s downtrend and start a new prolonged uptrend?
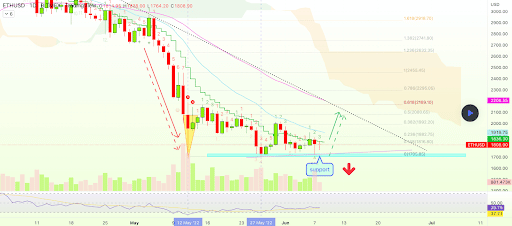
Ether’s price has also been trading near critical levels and today we’re looking at the ETH/USD 1D chart below by AlanSantana. At the time of writing, Ether’s price is trading between 0 [$1,705.85] and 0.236 [$1,882.75].
The marks that bullish ETH traders need to overcome are 0.236, 0.382 [$1,992.20], 0.5 [$2,080.65], and 0.618 [$2,169.10].
Bearish traders need to break the 0 fib level [$1,705.85] to create another major markdown on Ether’s price.

Ether’s Moving Averages: 5-Day [$1,820.04], 20-Day [$1,913.93], 50-Day [$2,541.88], 100-Day [$2,683.69], 200-Day [$3,257.98], Year to Date [$2,759.72].
ETH’s 24 hour price range is $1,774-$1,844 and its 7 day price range is $1,732-$1,909. Ether’s 52 week price range is $1,707-$4,878.
The price of ETH on this date in 2021 was $2,610.65.
The average price of ETH for the last 30 days is $1,963.93 and its -31.11% for the same timespan.
Ether’s price [-1.10%] closed its daily candle on Wednesday worth $1,792.96 and in red digits for a second straight day.
Chainlink Analysis
Chainlink’s price has been bucking the macro trend and has started a mini reversal of its own over the last few days. LINK’s price closed its daily session on Wednesday marginally down for the day but still outpaced the bulk of assets across the crypto sector. LINK’s price finished its daily session at $-0.01 on Wednesday.
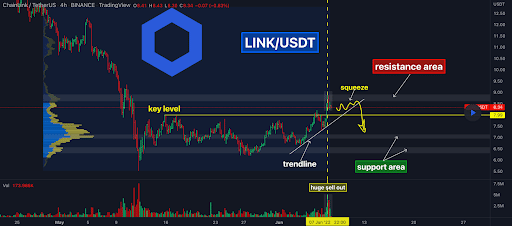
The third chart we’re analyzing today is the LINK/USD 4HR chart below from Yuriy_Bishko. LINK’s bullish market participants are attempting to break a key level in the pursuit of a reversal to a long-term downtrend.
LINK’s price has been trading downward on the charts since Chainlink made its current all-time high of $52.7 on May 10th, 2021.
We can see below that the $9 level is the current overhead resistance for bulls after months of acting as support. If bulls are able to break out to the upside their target is a trip back to the teens.
If bearish traders are able to deny LINK bulls at the $9 level then bullish LINK market participants will look for support again back at the $6 level.

Chainlink’s Moving Averages: 5-Day [$7.85], 20-Day [$7.25], 50-Day [$10.83], 100-Day [$13.18], 200-Day [$19.57], Year to Date [$14.52].
Chainlink’s 24 hour price range is $8.28-$8.85 and its 7 day price range is $6.74-$8.85. Chainlink’s 52 week price range is $5.56-$38.17.
LINK’s price on this date last year was $25.57.
The average price of LINK over the last 30 days is $7.39 and its -15.67% over the same time frame.
Chainlink’s price [-0.11%] closed its daily session on Wednesday worth $8.70. LINK’s price closed in red figures by just one cent which broke up a streak of four consecutive green daily candles.
The post Bitcoin (30k), Ethereum (1.8k), Chainlink Price Analyses appeared first on The Cryptonomist.


