We have yet to see deeper levels of negative funding over sustained periods of time, so this may tell us the worst of the bear market is yet to come.

The below is a free, full excerpt from a recent edition of Bitcoin Magazine Pro, Bitcoin Magazine’s premium markets newsletter. To be among the first to receive these insights and other on-chain bitcoin market analysis straight to your inbox, subscribe now.
In today’s Bitcoin Magazine Pro, we will cover the historically significant 200-week moving average as well as cover the weekend price action and derivative market movements.
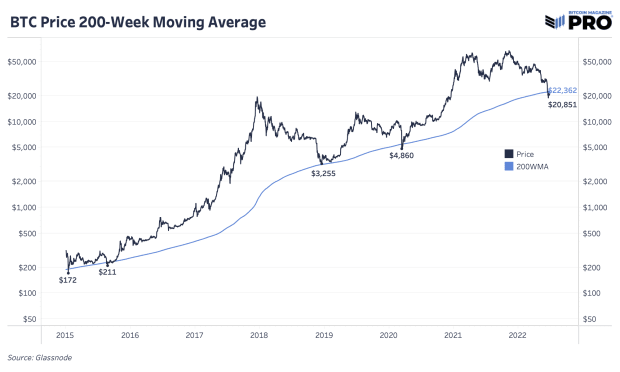
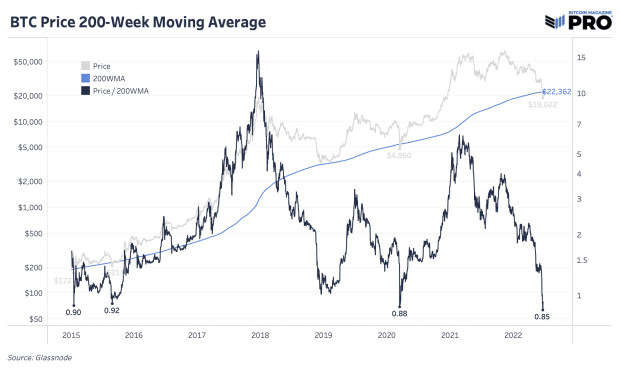
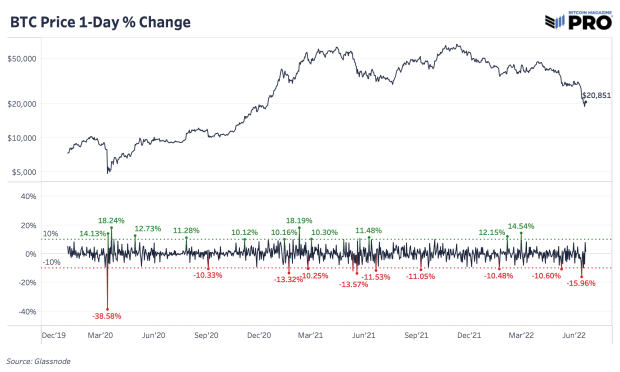
Bitcoin is currently below its 200-week moving average, which has only happened four times throughout bitcoin’s history, marking significant cyclical bottoms, but none have occurred during the unique economic situation we find ourselves in today. Although today and this past weekend likely will look like prime accumulation opportunities five years from now, it’s difficult to conclude that the worst is over and it’s up only from here, with potentially more cryptocurrency-native contagion and macro headwinds ahead. Regardless of the ugly macroeconomic backdrop (which the market has undoubtedly been pricing in for the last six months), a simple look at the 200-week moving average to build a framework for bitcoin accumulation has served past market participants extremely well.
Derivative Market Shenanigans
Our issues last week were entirely focused on the cryptocurrency-native contagion taking place, as industry-wide panic occurred on whether various counterparties were solvent, and whether funds on various platforms were safe for users/depositors.
Read last week’s issues here:
- Monday’s issue – Celsius Exchange Halts Withdrawals: What Went Wrong?
- Tuesday’s issue – Celsius And stETH – A Lesson On (il)Liquidity
- Wednesday’s issue – Three Arrows Capital Faces Liquidation
- Thursday’s issue – Fears of Further Contagion
- Friday’s issue – 3AC And The Leaning Tower Of Babel
While much of the sell-off was driven by forced selling due to collateralized loans on DeFi protocols (or the fear thereof), the derivative market on centralized exchanges also deserves a close look, as it still plays a vital role in the movement of the market over the short/medium term.
As price fell below $20,000 for bitcoin and $1,000 for ether, perpetual swap futures open interest exploded and funding rates went sharply negative.
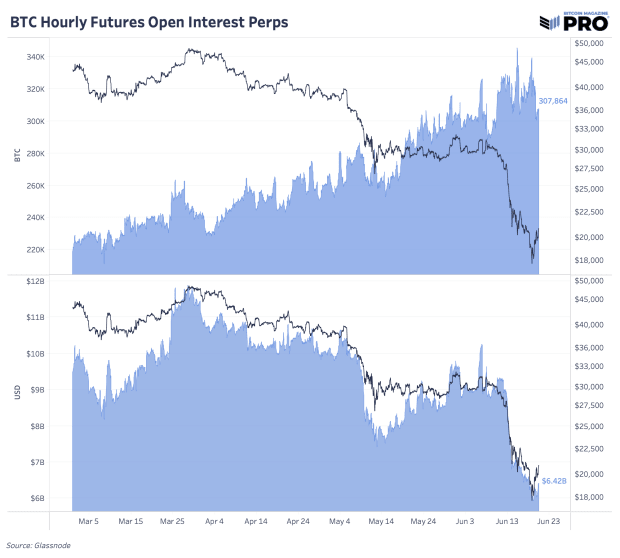
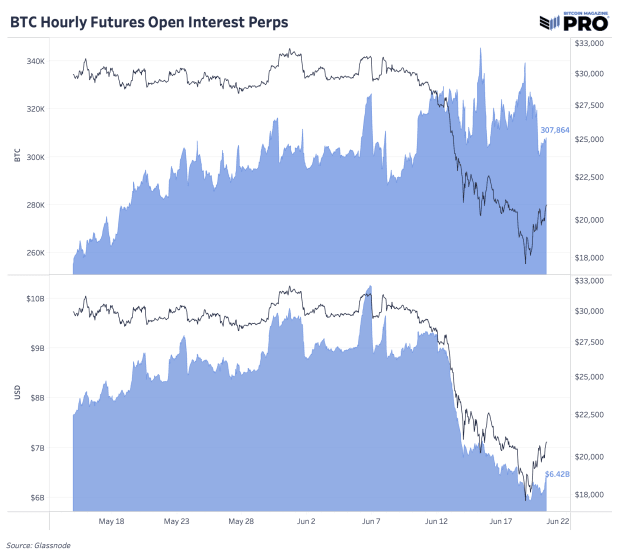
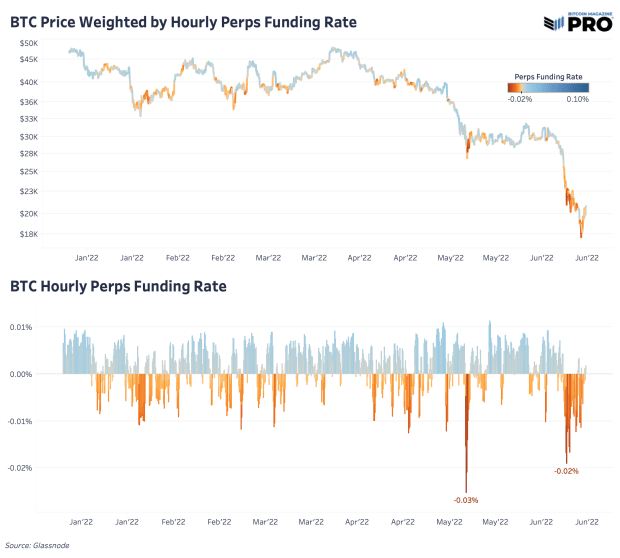
In layman’s terms, this means that as the markets fell, derivative traders drove the price lower with an increasing amount of leveraged capital, with negative funding rates showing that perpetual futures contracts were leading the way down.
As the price reached the mid $17,000s and found a bid, late shorts found themselves offside, and became forced buyers higher as the market quickly reversed and flew back to the $20,000 level before the weekend was over. There is no free lunch in the market, and the bitcoin market has a way of punishing all undisciplined/over-leveraged market participants through its notorious volatility. This derivative market data leads us to the conclusion that the rally back to $20,000 was more a function of shorts covering.
It should be noted that one of the telltale signs of a bitcoin bottom is a heavily-shorted market, and comparing the derivative market data to that of previous years shows that that period may very soon be upon us.
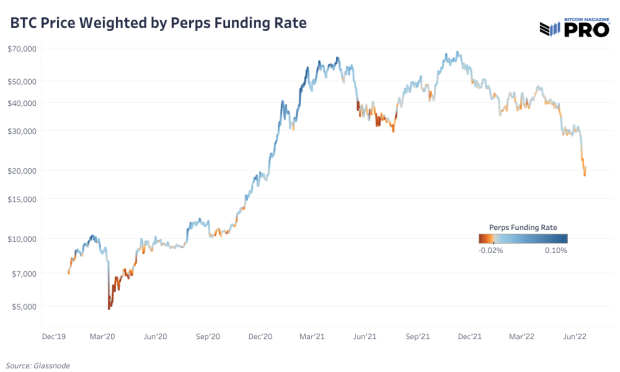
A heavily-shorted bitcoin derivatives market is a market primed to fly higher, and while we saw a strong reversal above $20,000 due to a squeeze of short positions over the weekend, the worst may be yet to come.
Sustained periods of negative funding for perpetual futures and backwardation (futures price below spot price) are two of the biggest telltale signs of a market primed for reversal to the upside.
While short positioning has been more frequent and severe in recent days than it has been over the course of the last six months, deeper levels of negative funding over sustained periods of time is what to look for during a true market cycle bottom (when analyzing past cycle lows).


