Bitcoin Analysis
Bitcoin’s price closed above the 2017 cycle top high of $19,891 on Wednesday as bulls continue to carve out further support at that level. BTC’s price retested that level and concluded its daily session on Wednesday -$749.9.
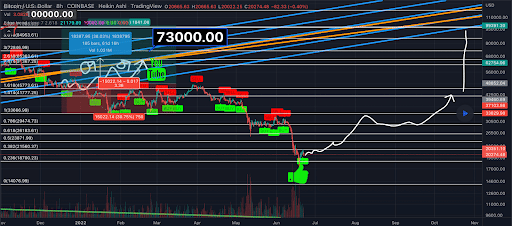
The BTC/USD 8HR chart below from Shiva-Sativa is the first chart we’re analyzing for Thursday. BTC’s price is trading between 0.236 [$18,700.23] and 0.382 [$21,560.27], at the time of writing.
The targets to the upside for bullish traders if they can hold the $19,8k level are 0.382, 0.5 [$23,871.99], and 0.618 [$26,183.61].
Conversely, the targets for bearish traders to the downside of the chart if they can break $19,8k are 0.236, and a full retracement at 0 [$14,076.99].

Bitcoin’s Moving Averages: 5-Day [$20,627.99], 20-Day [$26,654.01], 50-Day [$31,738.93], 100-Day [$36,862.73], 200-Day [$44,010.5], Year to Date [$37,588.79].
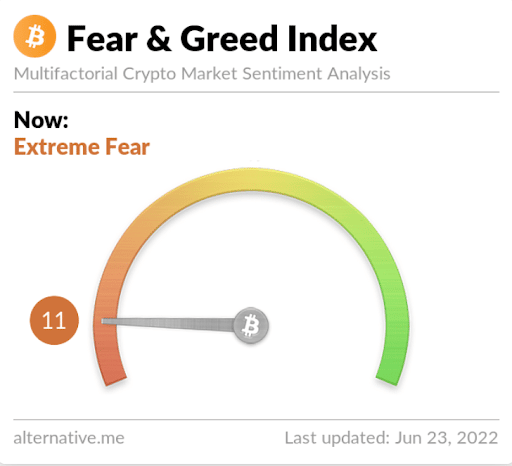
The Fear and Greed Index is 11 Extreme Fear and is equal to Wednesday’s reading.

BTC’s 24 hour price range is $19,730-$20,848 and its 7 day price range is $17,760-$22,664. Bitcoin’s 52 week price range is $17,611-$69,044.
The price of Bitcoin on this date last year was $33,703.
The average price of BTC for the last 30 days is $27,009.7 and its -31.5% over the same time frame.
Bitcoin’s price [-3.62%] closed its daily candle worth $19,943 and BTC has been alternating between red and green candles for the last nine days.
Ethereum Analysis
Ether’s price sold-off nearly twice as hard as bitcoin’s price on Wednesday and ETH wrapped-up its daily session -$76.99.
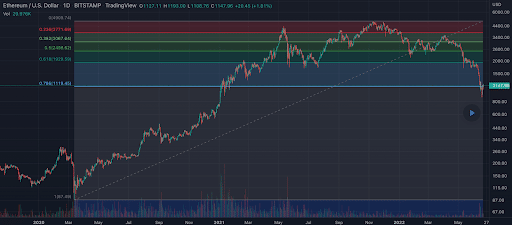
The ETH/USD 1D chart below by aeloxcom is the second chart we’re looking at today and it shows an ongoing battle at the 0.786 fibonacci level [$1,119.45].
Bullish ETH traders want to regain 0.618 [$1,929.59] if they can hold the 0.786. Above 0.618 the targets are 0.5 [$2,498.62] and 0.382 [$3,067.64].
From the perspective of bearish ETH traders, they’re attempting to send ETH’s price back below the $1k level and eventually revisit 1 [$87.49] on the daily time frame.

Ether’s Moving Averages: 5-Day [$1,107.81], 20-Day [$1,548.35], 50-Day [$2,143.94], 100-Day [$2,549.83], 200-Day [$3,143.68], Year to Date [$2,637.85].
ETH’s 24 hour price range is $1,043.65-$1,130.17 and its 7 day price range is $897.49-$1,235.88. Ether’s 52 week price range is $883.62-$4,878.
The price of ETH on this date in 2021 was $1,967.83.
The average price of ETH for the last 30 days is $1,599.85 and its -45.2% over the same duration.
Ether’s price [-6.84%] closed its daily candle on Wednesday worth $1,049.07 and in red figures for a third consecutive day.
Litecoin Analysis
Litecoin’s price also traded lower at the close than at the open of Wednesday’s daily session and LTC finished the day -$1.44.
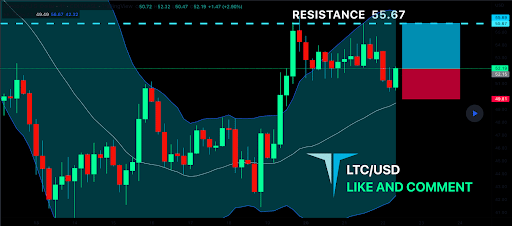
The third chart we’re looking at this Thursday is the LTC/USD 1D chart below from EliteTradingSignals.
LTC’s price has overhead resistance at the $55.67 level. LTC’s price has been consolidating for nearly a week now and is forming a pattern reminiscent of BTC on the daily time frame.
Bullish Litecoin traders have historical support looking left at the $49.81 level but if bulls lose that level they should anticipate another sizable markdown in price.

LTC is -57.24% against The U.S. Dollar for the last 12 months, -30.27% against BTC, and -23.9% against ETH, over the same duration.
Litecoin’s Moving Averages: 5-Day [$50.28], 20-Day [$57.42], 50-Day [$76.69], 100-Day [$96.40], 200-Day [$133.66], Year to Date [$102.14].
Litecoin’s 24 hour price range is $50.41-$54.7 and its 7 day price range is $42.07-$55.54. LTC’s 52 week price range is $40.4-$295.1.
Litecoin’s price on this date last year was $128.98.
The average price of LTC over the last 30 days is $58.86 and its -25.57% over the same timespan.
Litecoin’s price [-2.69%] closed its daily candle worth $52.09 and LTC has been alternating between green and red candles over the last eight days.
The post Bitcoin (20K), Ethereum (1K), Litecoin Price Analyses appeared first on The Cryptonomist.


