Bitcoin Analysis
Bitcoin’s price managed to cling to the historical $20k level on Wednesday but bears again sent BTC’s price lower and the world’s premiere digital asset concluded the day -$160.4.
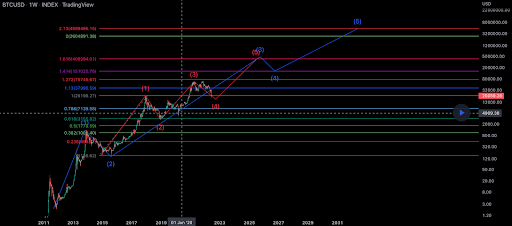
The first chart we’re analyzing for Thursday is the BTC/USD 1W chart below by ali_1673. BTC’s price is trading between the 0.786 fibonacci level [$7,139.58] and 1 [$20,198.27], at the time of writing.
The next overhead resistance for bulls after the 1 fib level is 1.13 [$37,990.59], 1.272 [$75,746.67] and 1.414 [$151,025.76].
Conversely, bearish BTC market participants are looking for BTC’s price to next test 0.786 followed by 0.618 [$3,155.82] and 0.5 [$1,778.59].

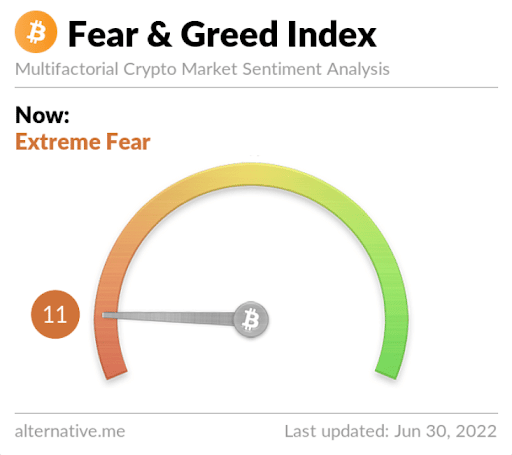
The Fear and Greed Index is 11 Extreme Fear and is -2 from Wednesday’s reading of 13 Extreme Fear.

Bitcoin’s Moving Averages: 5-Day [$20,648.89], 20-Day [$24,242.46], 50-Day [$29,716.25], 100-Day [$35,784.58], 200-Day [$43,413.17], Year to Date [$36,921.88].
BTC’s 24 hour price range is $19,844-$20,430 and its 7 day price range is $19,958-$21,637. Bitcoin’s 52 week price range is $17,611-$69,044.
The price of Bitcoin on this date last year was $35,043.5.
The average price of BTC for the last 30 days is $25,144.8 and its -30.7% over the same duration.
Bitcoin’s price [-0.79%] closed its daily candle worth $20,106.6 and in red figures for a fourth day in a row.
Ethereum Analysis
Ether’s price finished lower as well on Wednesday and concluded its daily session -$44.48.
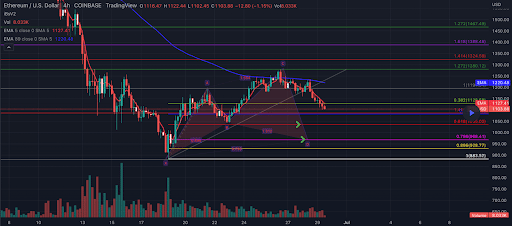
The second chart we’re looking at for Thursday is the ETH/USD 4HR chart below by Hiddenharmonicstrading. Ether’s price is trading between 0.786 [$968.41] and 0.618 [$1,035.02], at the time of writing.
The primary overhead target for bullish ETH market participants is 0.382 [$1,128.59] followed by a secondary target of 1 [$1,194.64].
Bearish traders have a primary aim of pushing ETH’s price back below 0.786 with 0.886 [$928.77] as a secondary target. The third target for bearish traders of ETH is 1 [$883.57].

Ether’s Moving Averages: 5-Day [$1,165.75], 20-Day [$1,374.13], 50-Day [$1,954.82], 100-Day [$2,456.35], 200-Day [$3,009.10], Year to Date [$2,579.93].
ETH’s 24 hour price range is $1,087.42-$1,156.8 and its 7 day price range is $1,051.07-$1,265.94. Ether’s 52 week price range is $883.63-$4,878.
The price of ETH on this date in 2021 was $2,274.99.
The average price of ETH for the last 30 days is $1,442.94 and its -37.67% for the same time frame.
Ether’s price [-3.89%] closed its daily candle on Wednesday worth $1,099.54 and ETH’s price has also concluded its last four daily sessions in negative figures.
Matic Analysis
Matic’s price finished lower again on Wednesday and when traders settled up at close Matic was -$0.014 for the day.
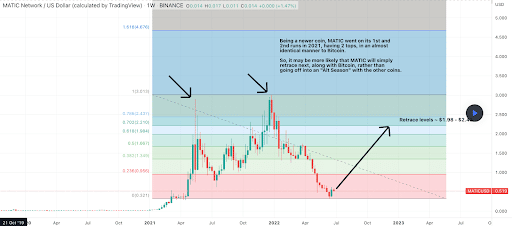
The MATIC/USD 1W chart below from micah_trader shows Matic’s price trading between 0 [$0.321] and 0.236 [$0.956], at the time of writing.
Bullish Matic traders are eying the 0.236 followed by 0.382 [$1.349] and 0.5 [$1.667].
For bearish traders, their first target is a full retracement to the $0.32 level. If that level is broken Matic market participants could yet be in for another steep decline in price.

Polygon’s 24 hour price range is $0.485-$0.547 and its 7 day price range is $0.456-$0.621. Matic’s 52 week price range is $0.317-$2.92.
Polygon’s price on this date last year was $1.16.
The average price of MATIC over the last 30 days is $0.531 and its -14.34% for the same timespan.
Matic’s price [-2.88%] closed its daily candle worth $0.497 and in red digits for a fifth straight day.
The post Bitcoin (19k), Ethereum (1k), Matic Price Analyses appeared first on The Cryptonomist.


