Bear market rallies look to be playing out for both the S&P 500 Index and bitcoin. How high can the rally go? What do historical rallies look like?

The below is an excerpt from a recent edition of Bitcoin Magazine Pro, Bitcoin Magazine’s premium markets newsletter. To be among the first to receive these insights and other on-chain bitcoin market analysis straight to your inbox, subscribe now.
Bitcoin Bear Market Rallies
Bear market rallies, whether it’s equities or bitcoin, are a similar cyclical move that’s played out in markets time and time again. They can be convincing and volatile as investors become too far positioned in one direction.
We want to highlight the bear market rally case for bitcoin. As bitcoin has been closely following broader risk-on assets this cycle, it’s likely that continues as the market heads lower over the coming months.
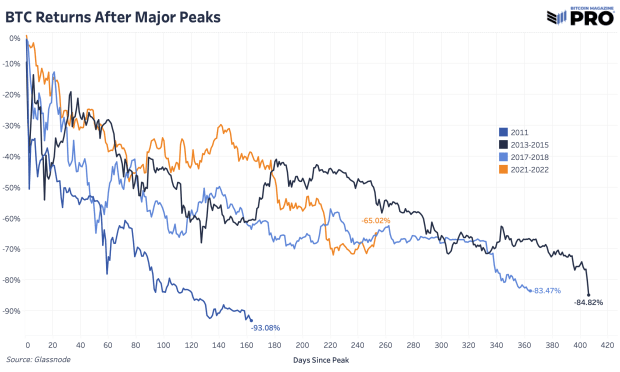
We have bitcoin-specific bear market cycles. After the most recent rally, bitcoin is down 65% from the all-time high in November, 253 days in. 2013 and 2017 cycles found a bottom at 84.82% and 83.47% drawdowns, respectively, with both lasting close to around 400 days. Bitcoin’s latest rally is not out of the ordinary for the typical bear market rally move. Even a move to $30,000 is reasonable.

Typically, bear market cycles in the legacy world end after a 20% move up from the lows so having a cycle that printed new all-time highs seems like a stretch. Yet, looking at this way is compelling from a duration of 435 days and drawdown of 70%, which would fit the idea that all-time high drawdowns lessen over time.
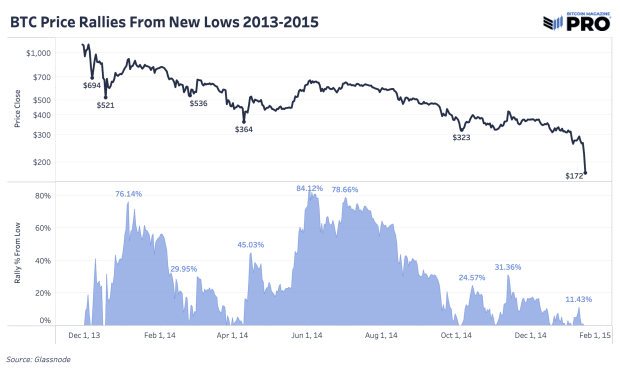
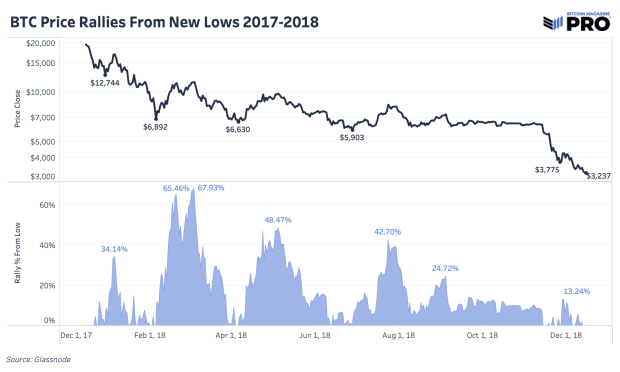
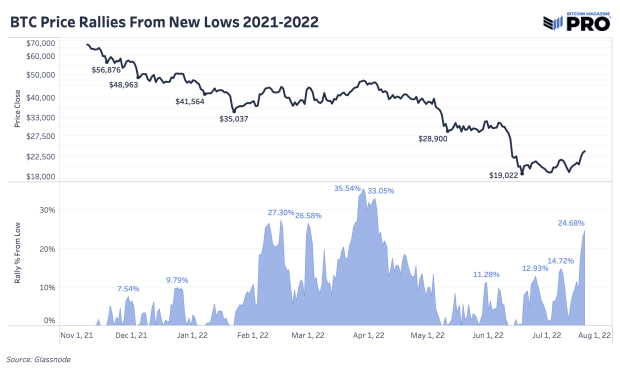
The other way to look at the rallies is to see how high prices move off of new lows. Below we have the rally percentages from new lows across cycles. Using daily close prices and not absolute bottom wick prices, the 2013-2015 cycle saw rally gains of 84.12% at its highest while 2017-2018 saw 67.93%. In the current cycle we’ve seen a 35.54% rally move at its highest while the latest move, at the time of writing, is around 26%.


Final Note
There’s a case to be made for the bitcoin bottom being in amid the wave of forced liquidations, capitulation-like behavior and nearly every mean-reversing cycle metric printing a good long-term opportunity to accumulate. Yet, our research and analysis leads us to these questions:
How far will equities fall? Is a 23.55% drawdown from all-time high in the S&P 500 Index the worst we see in this market? Are economic and liquidity conditions getting better to justify a reversal? Has there been a fundamental change or catalyst for bitcoin to suggest it won’t follow broader market moves?
It’s possible that bitcoin has already front-runned that move and will likely be the asset to bottom first, anyway. We’re convinced that the more likely case is that bitcoin will at least revisit previous lows and likely make a new one.


