Demand dried up below solid resistance, leading to a 15% correction in Ripple price. Although the bears increased the selling pressure on the first day of the week and sent the price towards the 50-day moving average, relative calm has prevailed in the last three days.
Technical Analysis
By Grizzly
The Daily Chart:
The battles between the bears and bulls are still going on in the $0.3 and $0.39 range. Although the bulls have successfully formed higher lows step by step, the bears have not allowed XRP to set up a higher high above $0.39 (in red).
The recent bearish leg sent the price towards the 0.618 Fib level (in white). It is imperative that buyers sustain the cryptocurrency above this level. It could help it to get another chance to retest the red resistance zone. After that, XRP bounced off support and has stalled for now by reaching the 0.236 Fib level. The continuation of the formed bullish structure depends on closing a candle above the red resistance zone. Considering that this level has been tested twice so far, its strength is expected to decrease with more hits.
Key Support Levels: $0.33 & $0.30
Key Resistance Levels: $0.39 & $0.42

Daily Moving Averages:
MA20: $0.34
MA50: $0.34
MA100: $0.42
MA200: $0.59
The XRP/BTC Chart:
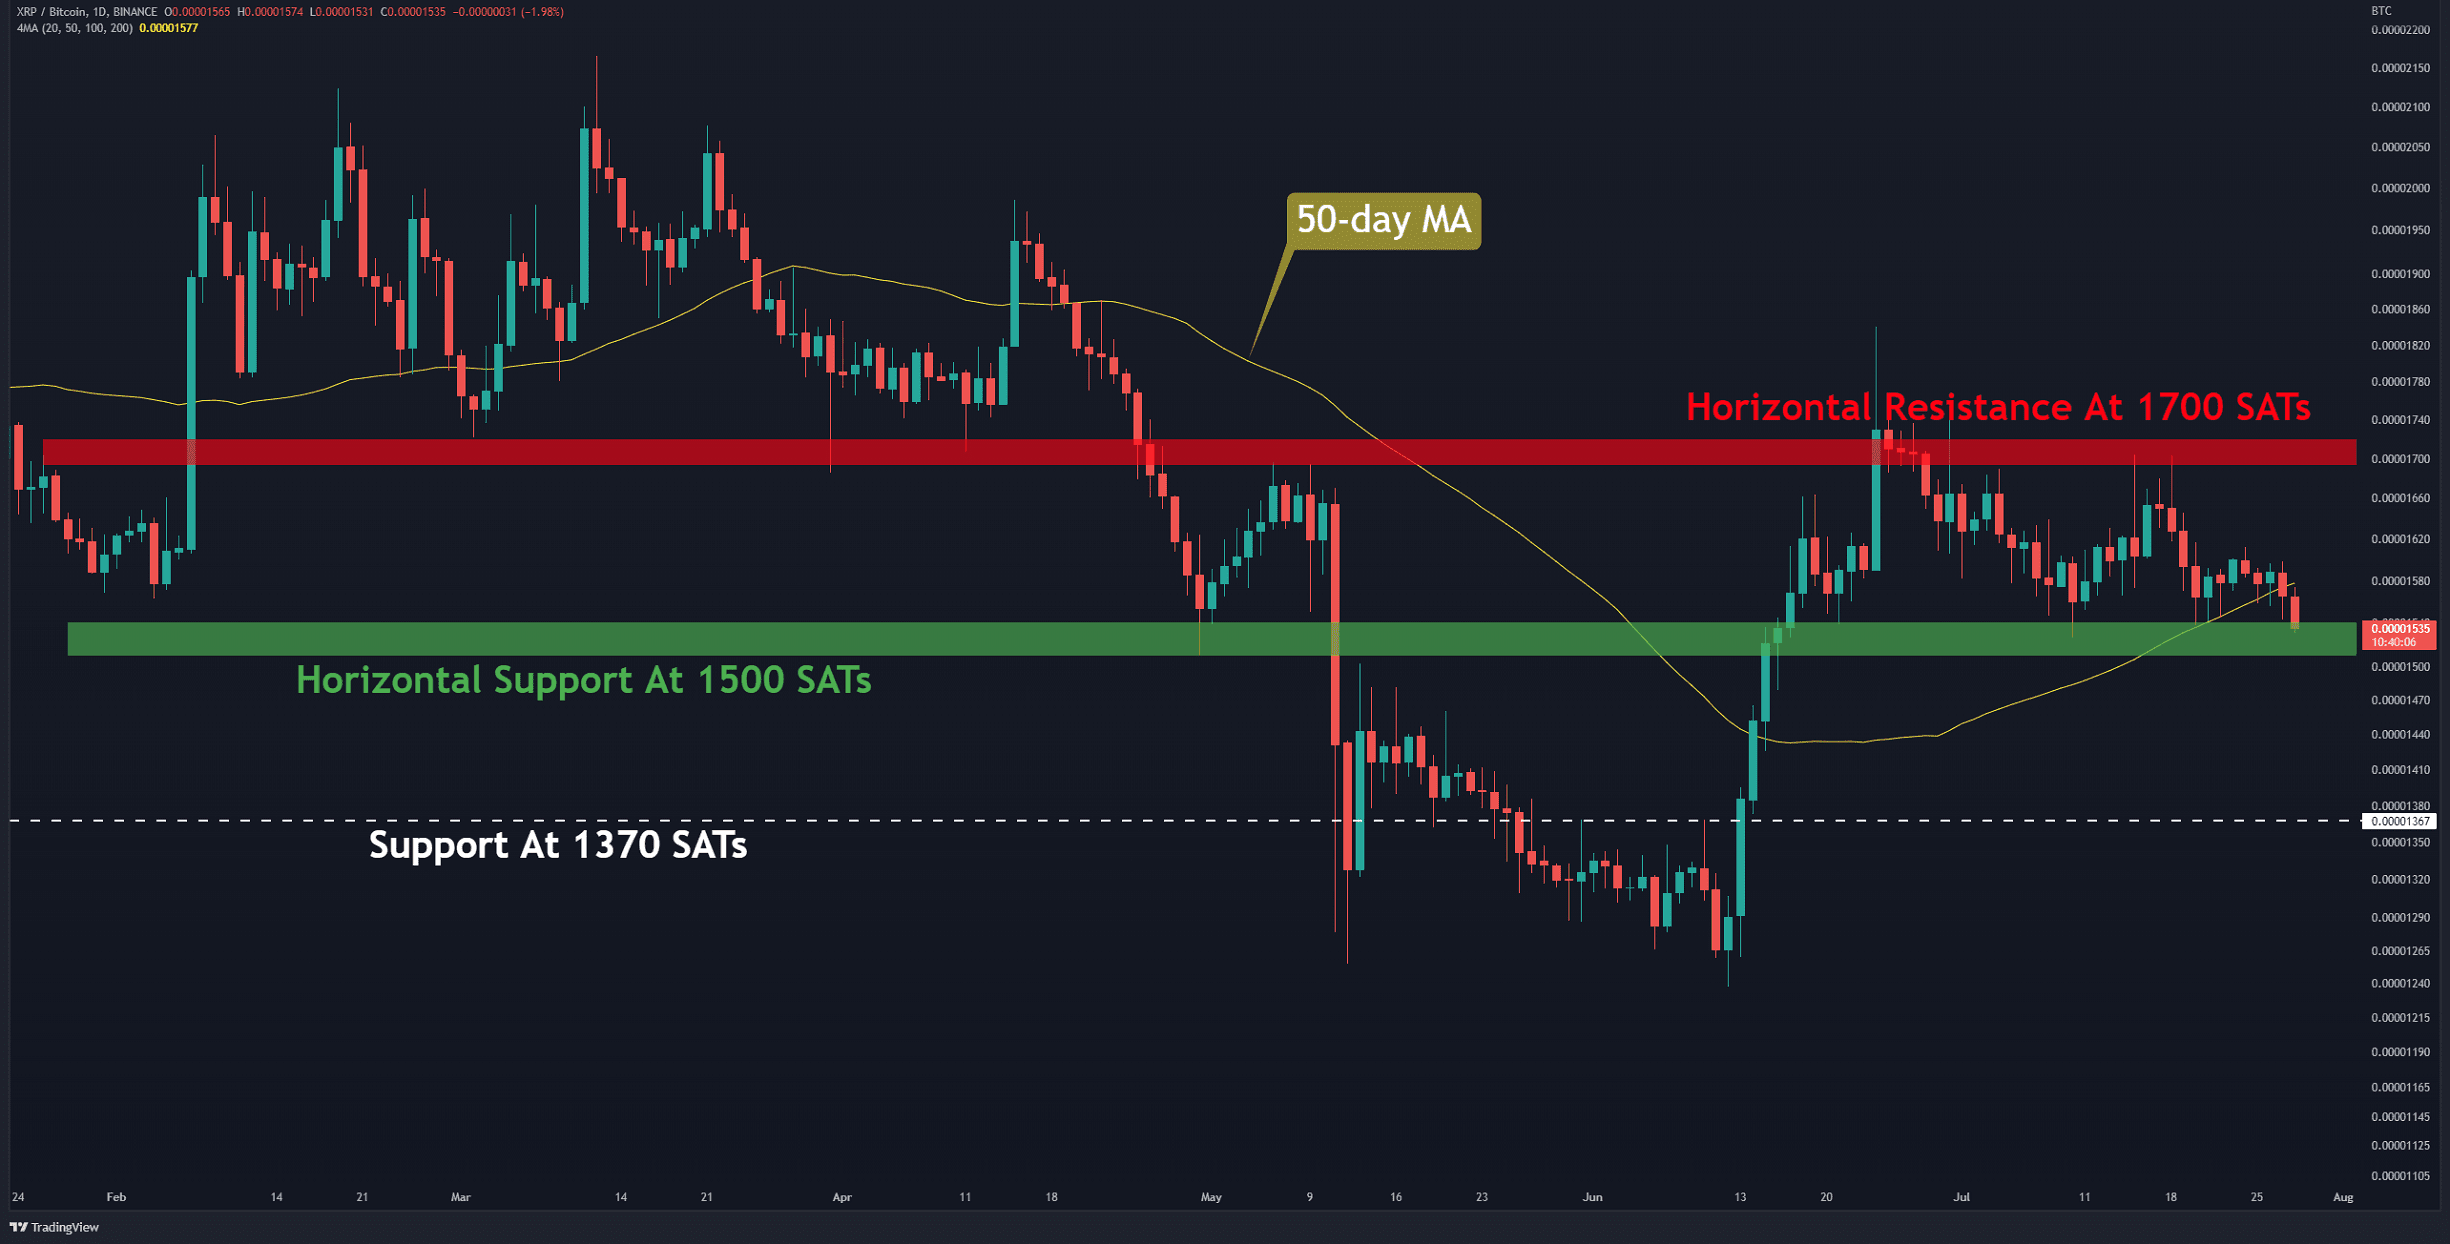
The bulls are determined to hold the price above 1500 SATs (in green) against Bitcoin. Even though the bears have tested this level three times in the last month, they did not manage to break below it. A break and close below this level can signal the start of a new corrective trend.
This wave can continue until the horizontal support at 1370 SATs. On the other hand, suppose the bulls break out from this sideways range and break above the horizontal resistance at 1700 SATs (in red). Such a move can shoot the price towards 2100 SATs.
Due to Bitcoin’s better performance relative to XRP, the price has now penetrated below the 50-day moving average (in yellow).

Key Support Levels: 1500 SATs & 1370 SATs
Key Resistance Levels: 1700 SATs & 2100 SATs


