Bitcoin Analysis
Bitcoin’s price closed in negative figures for a fifth consecutive day on Tuesday but sellers have really failed thus far to do much technical damage even on lower time frames. When traders settled-up at BTC’s candle close on Tuesday it was -$275.
The first chart we’re looking at today is the BTC/USD 1W chart below from TradingForArab. The price of bitcoin is trading between the 38.20% fibonacci level [$21,272.19] and 0.00% [$69,366.14], at the time of writing.
The BTC target to the upside on the weekly time frame for bullish traders is back up to test BTC’s all-time high made on November 10th, 2021.
Conversely, bearish BTC traders are first eyeing the 38.20% fib level with a secondary target of 50.00% [$14,765.31]. The third target below for bearish bitcoin traders is 61.80% [$10,248.8].

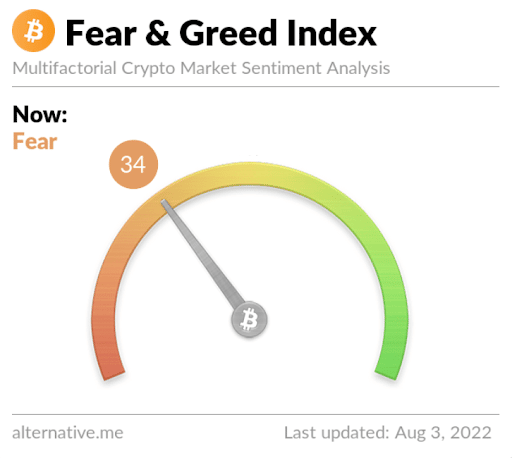
The Fear and Greed Index is 34 Fear and is +3 from Tuesday’s reading of 31 Fear.

Bitcoin’s Moving Averages: 5-Day [$23,331.02], 20-Day [$21,928.66], 50-Day [$23,650.12], 100-Day [$31,226.73], 200-Day [$39,511.23], Year to Date [$34,494.06].
BTC’s 24 hour price range is $22,676-$23,466 and its 7 day price range is $21,079-$24,581. Bitcoin’s 52 week price range is $17,611-$69,044.
The price of Bitcoin on this date last year was $38,207.
The average price of BTC for the last 30 days is $21,708 and its +21.1% over the same duration.
Bitcoin’s price [-1.18%] closed its daily candle worth $22,984 on Tuesday.
Ethereum Analysis
Ether’s price broke a streak of four straight closes in negative figures on Tuesday but just barely. ETH’s price closed +$1.29.
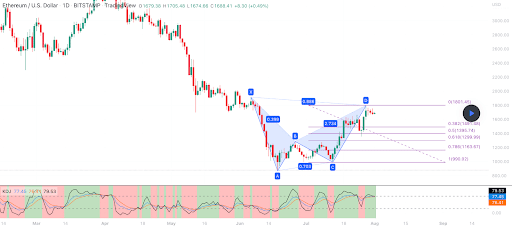
The second chart we’re looking at for this Wednesday is the ETH/USD 1D chart below by XTrendSpeed. ETH’s price is trading between 0.382 [$1,491.48] and 0 [$1,801.45], at the time of writing.
Bullish Ether market participants have their primary target of the $1,801 level which they’ve been unable to regain with candle close confirmation over the last week.
At variance with bulls are bearish traders that have targets to the downside of 0.382, 0.5 [$1,395.74], and 0.618 [$1,299.99].

Ether’s Moving Averages: 5-Day [$1,659.13], 20-Day [$1,410.81], 50-Day [$1,425.47], 100-Day [$2,119.37], 200-Day [$2,832.1], Year to Date [$2,386.86].
ETH’s 24 hour price range is $1,559.28-$1,678 and its 7 day price range is $1,425.38-$1,759.5. Ether’s 52 week price range is $883.62-$4,878.
The price of ETH on this date in 2021 was $2,508.37.
The average price of ETH for the last 30 days is $1,386.7 and its +57.6% over the same time frame.
Ether’s price [+0.08%] closed its daily candle on Tuesday worth $1,631.44.
Avalanche Analysis
Avalanche’s price followed bitcoin’s price lower on Tuesday and AVAX wrapped-up its trading session -$0.73.
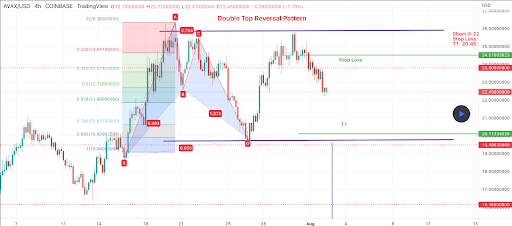
The last chart we’re providing analysis for this Wednesday is the AVAX/USD 4HR chart below from AbdulKamawi. Avalanche’s price is trading between 0.382 [$23.57] and 0.236 [$24.64], at the time of writing.
Overhead targets for bullish AVAX traders are 0.236 and a full retracement to 0 [$26.36].
Bearish Ether traders have their sights firstly on 0.382 with a secondary target of 0.5 [$22.72]. The third target to the downside on AVAX is 0.618 [$21.86].

AVAX’s 24 hour price range is $22.24-$24 and its 7 day price range is $20.27-$25.67. Avalanche’s 52 week price range is $12.34-$144.96.
Avalanche’s price on this date last year was $12.55.
The average price of AVAX over the last 30 days is $21.21 and its +47.21% over the same timespan.
Avalanche’s price [-3.1%] closed its daily trading session on Tuesday worth $22.84 and in red figures for the fourth day in a row.
The post Bitcoin (23k), Ethereum (1.6k), Avalanche price analyses appeared first on The Cryptonomist.


