The crypto market has seen a flurry of activity over the past few days, and Ethereum was no exception; most of the conversation centered around inflation and the Merge event. At long last, it seems that calmness has prevailed on the market, and everyone is waiting for ETH to reach the crucially important level of $2000.
Technical Analysis
By Grizzly
The Daily Chart
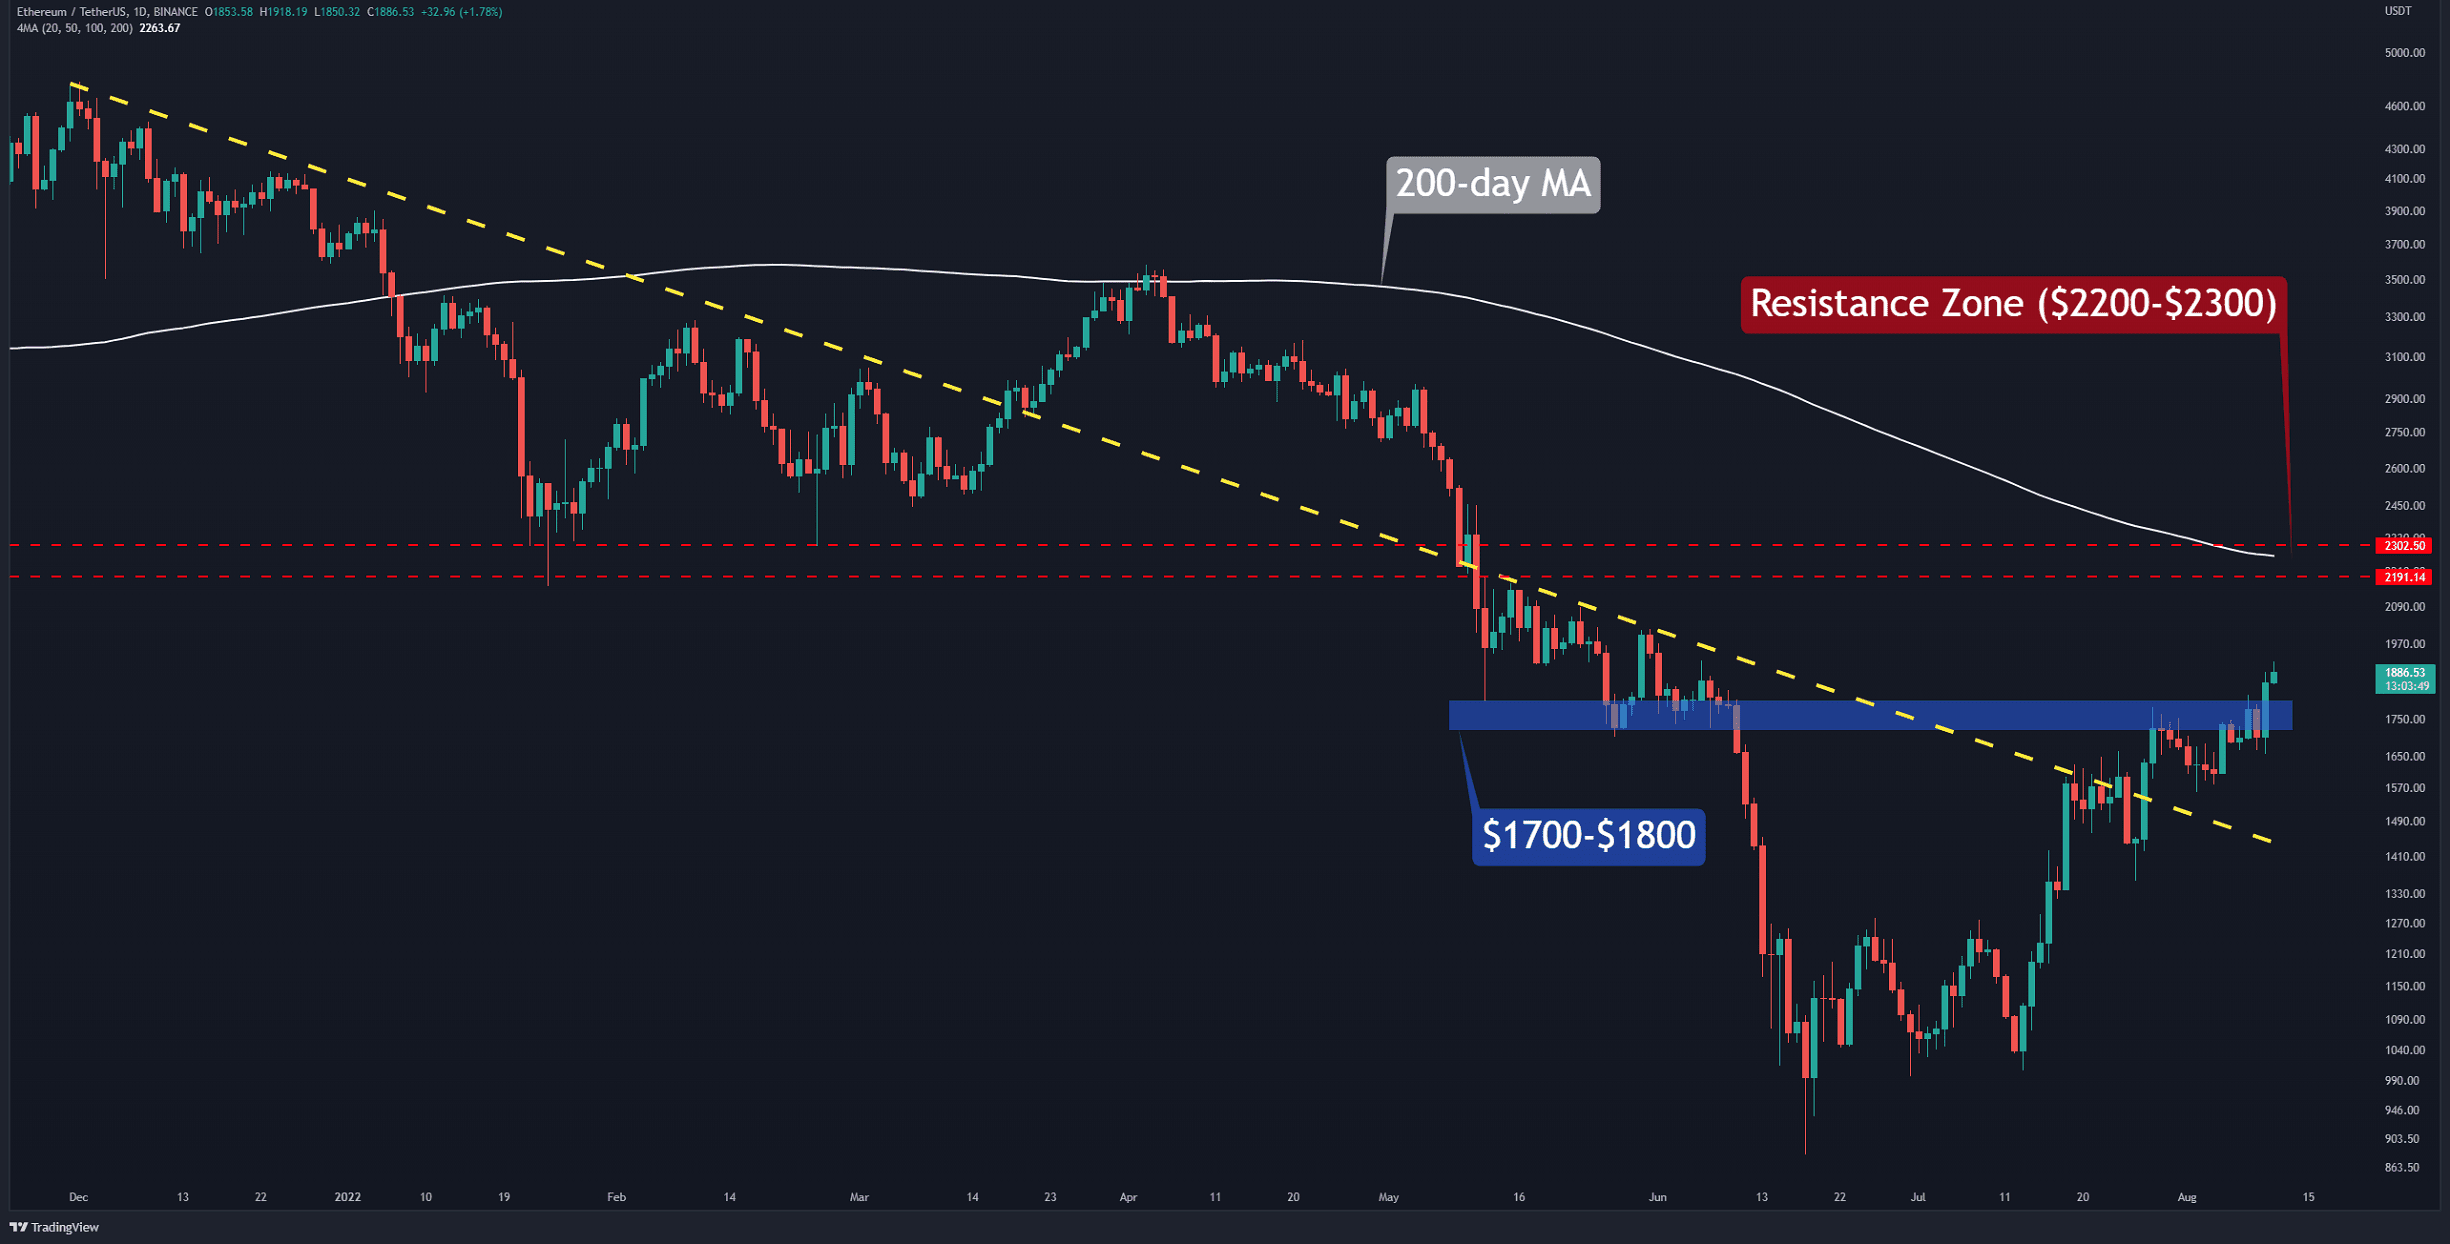
Ethereum has recorded an astonishing 16% gain in the past two days as it touched a high of $1930 at the time of this writing. The second largest cryptocurrency has ascended above the $1,700-$1,800 range (in blue). Reclaiming this resistance has increased the bullish sentiment in the market. It appears that the success of the Goerli merge has been a positive catalyst over the past 24 hours.
If the bulls can flip the resistance at $2000, then the way is paved to reach the resistance zone in the range of $2200-2300(in red), which overlaps with the 200-day moving average line (in white). It should be noted that the price may experience a brief pullback to retest $1,800 before reaching higher levels.
However, if the bears push the price below $1,700 by creating a bull trap, the above bullish scenario is invalidated. In this case, a downward trend will be triggered.
Currently, the advantage is in favor of the bulls, and the positive mark remains strong until a lower high and low is formed.
Key Support Levels: $1500 & $1350
Key Resistance Levels: $1800 & $2160
Daily Moving Averages:
MA20: $1668
MA50: $1406
MA100: $1618
MA200: $2263

The ETH/BTC Chart
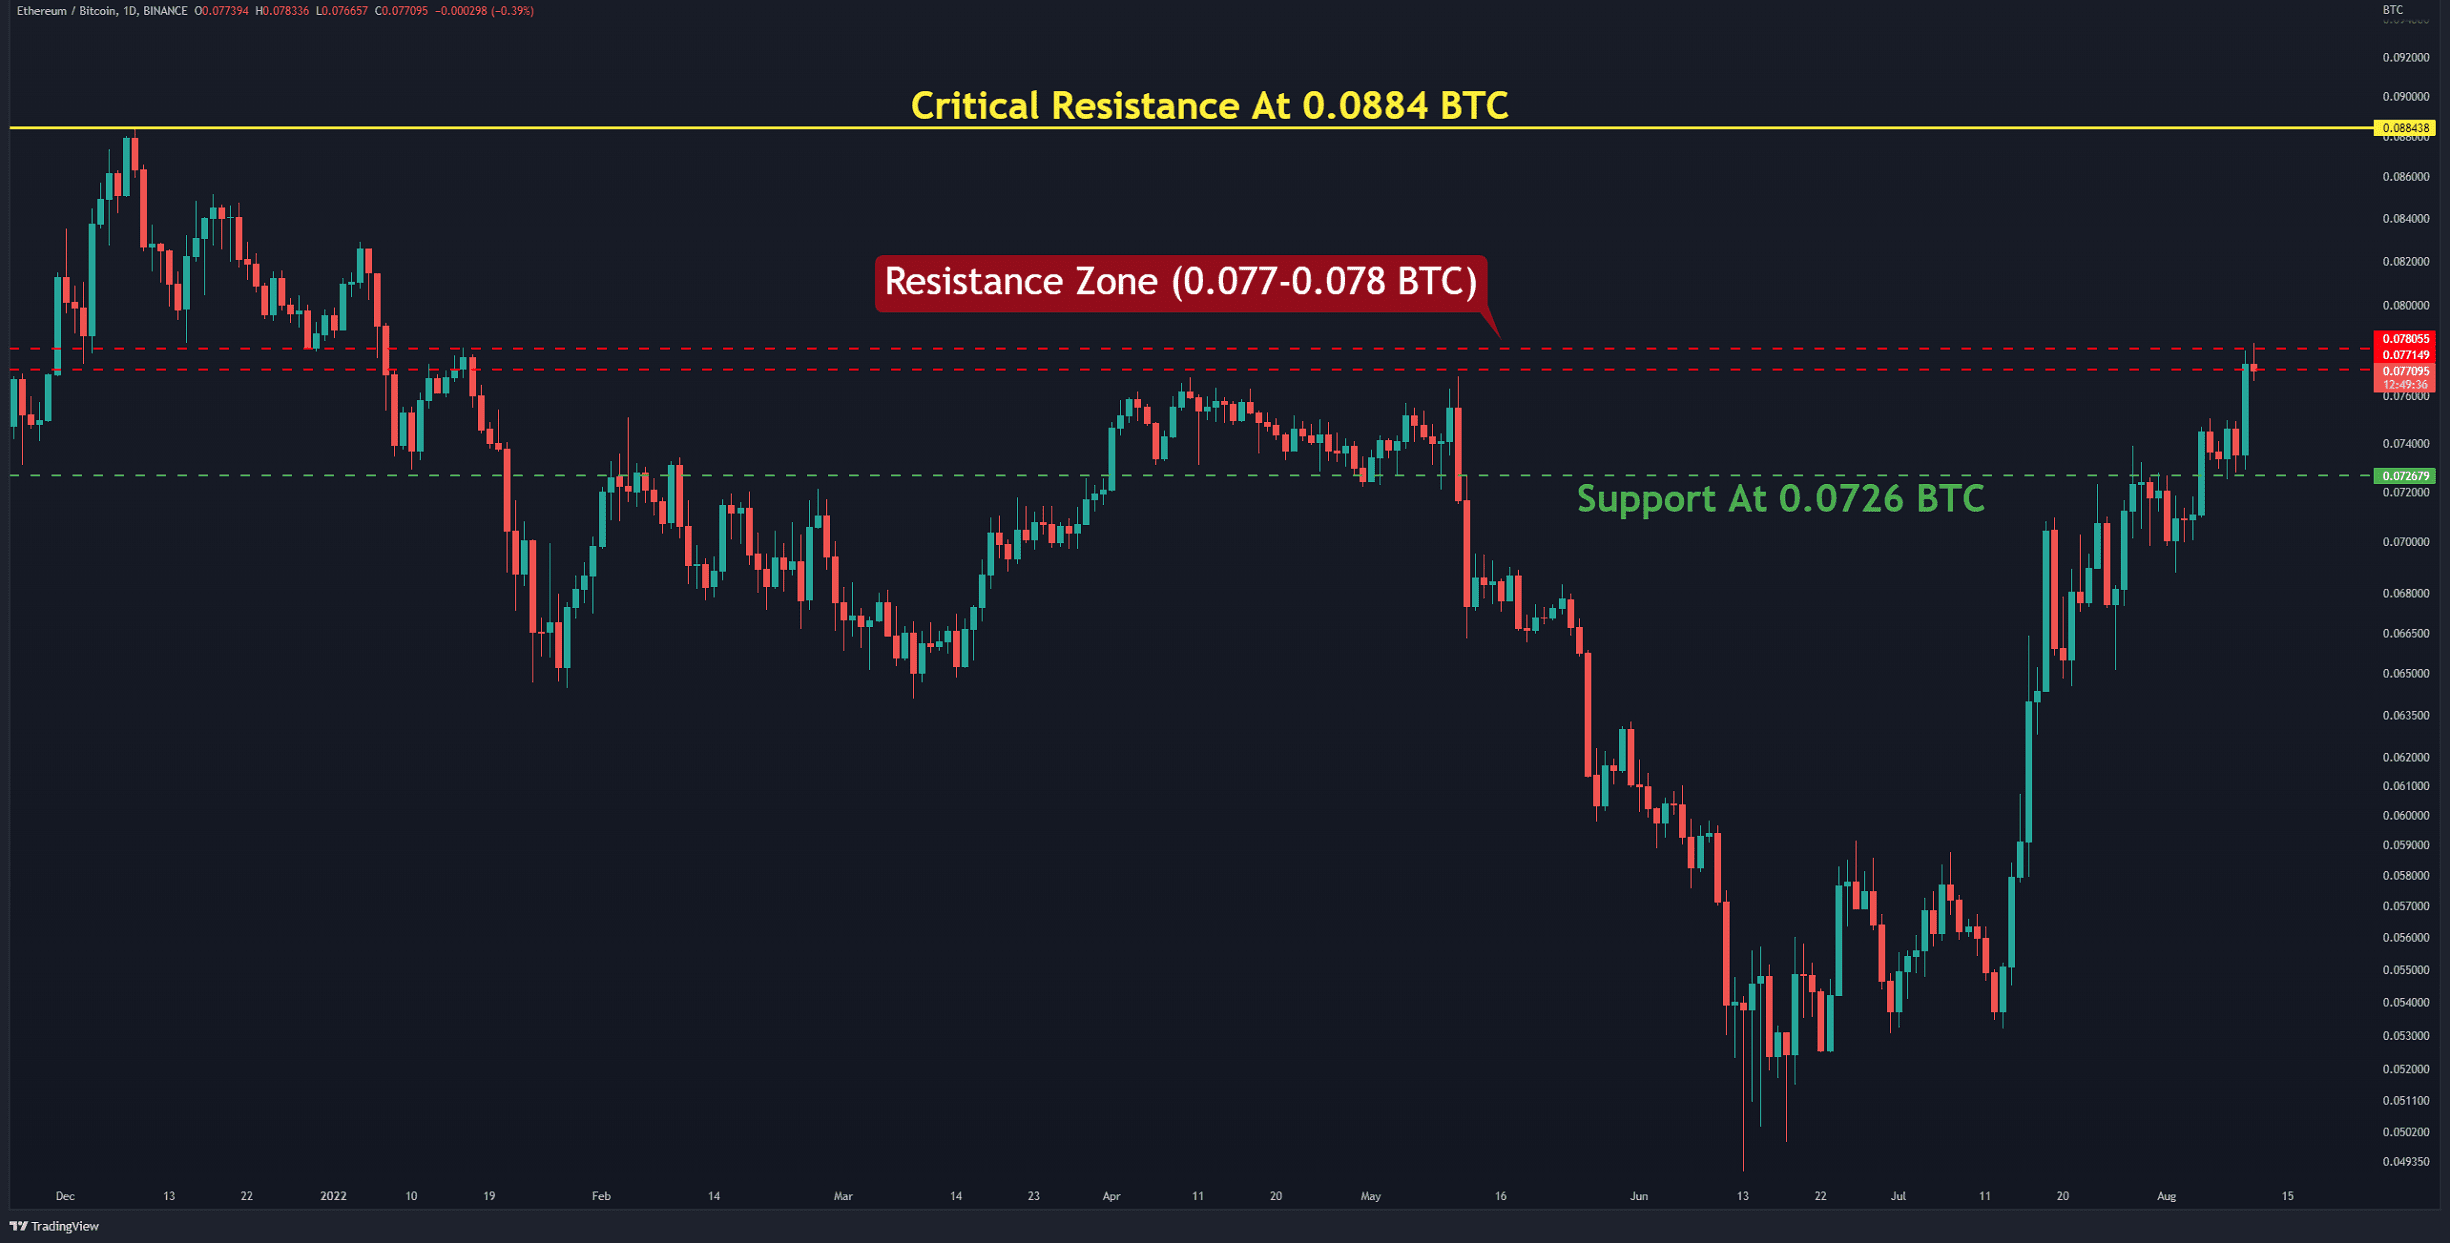
Against Bitcoin, ETH has hit the resistance zone in the range of 0.077-0.078 BTC (in red). There is still no sign of a trend reversal in the chart. A bullish structure has been formed that has easily broken all resistances. Therefore, if the bulls take a break here, the pair will find support at 0.0726 BTC (in green). A break and a close below this level confirm the trend reversal.
On the other hand, if the red resistance is broken, the price will expand to the critical resistance at 0.0884 BTC (in yellow), which was the highest level that the ETH price against BTC saw in the 2021 bull run.
Key Support Levels: 0.072 & 0.065 BTC
Key Resistance Levels: 0.078 & 0.088 BTC

On-chain Analysis
Exchange Inflow/Outflow (Mean, MA7)
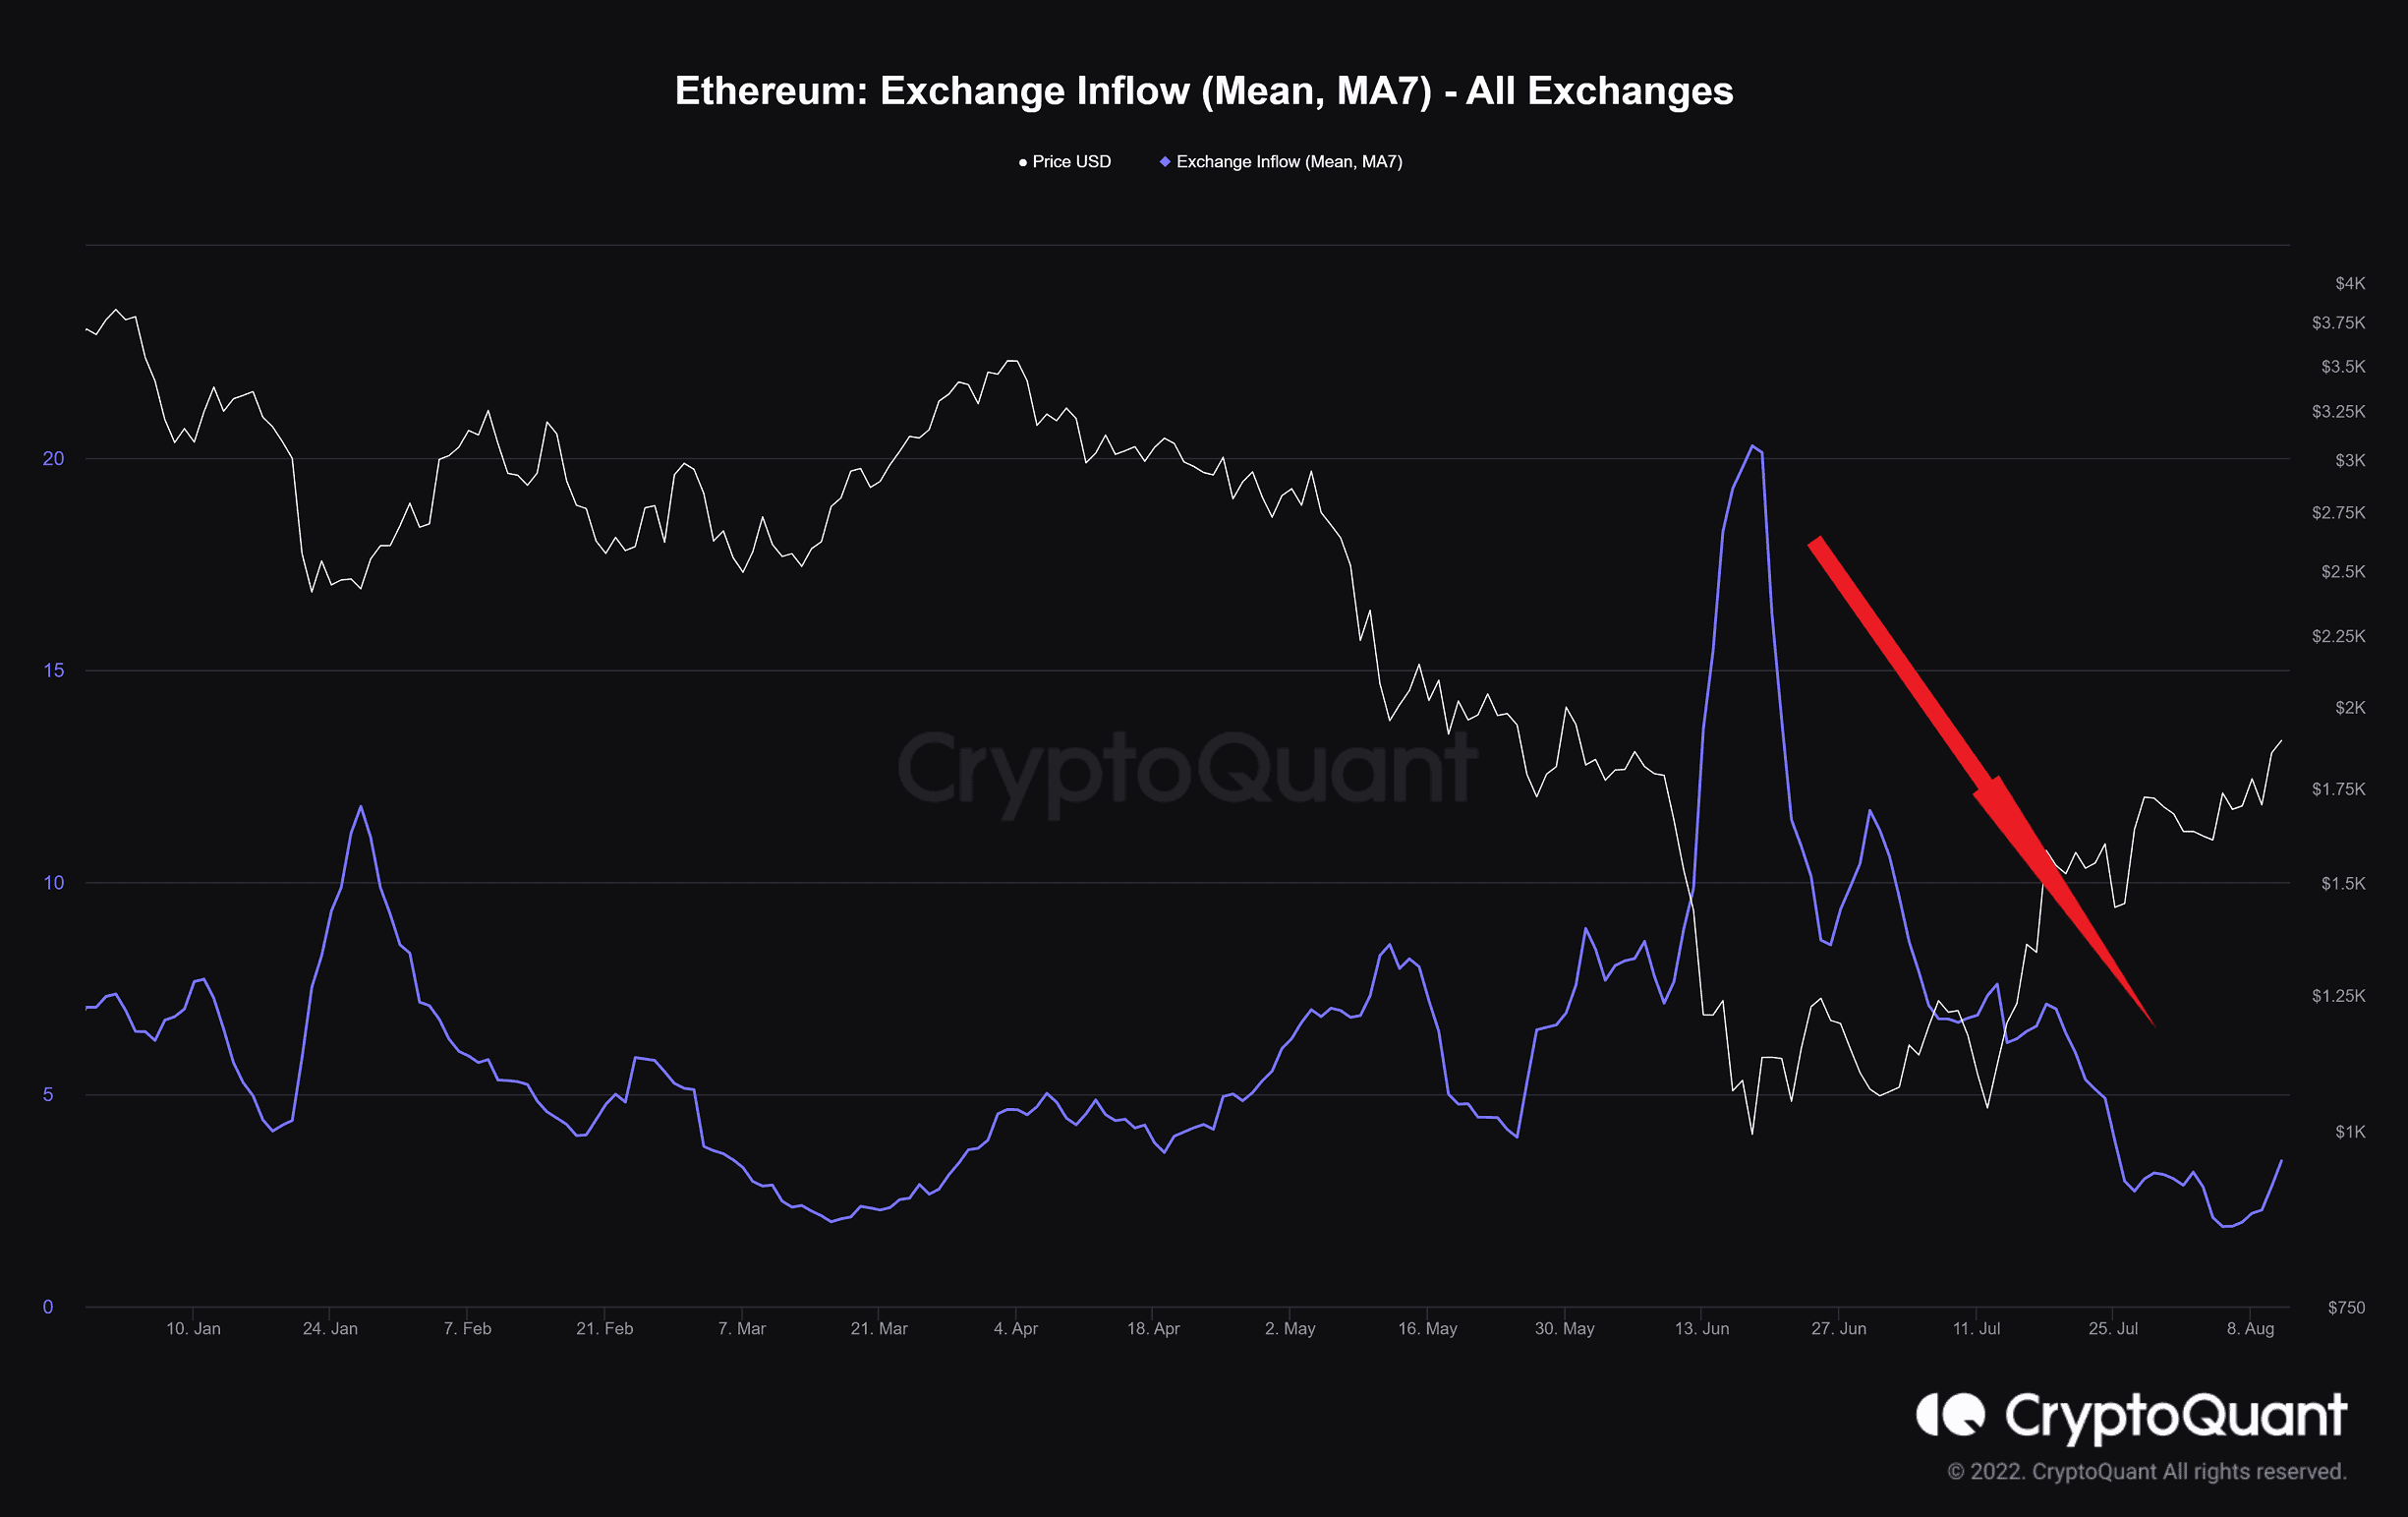
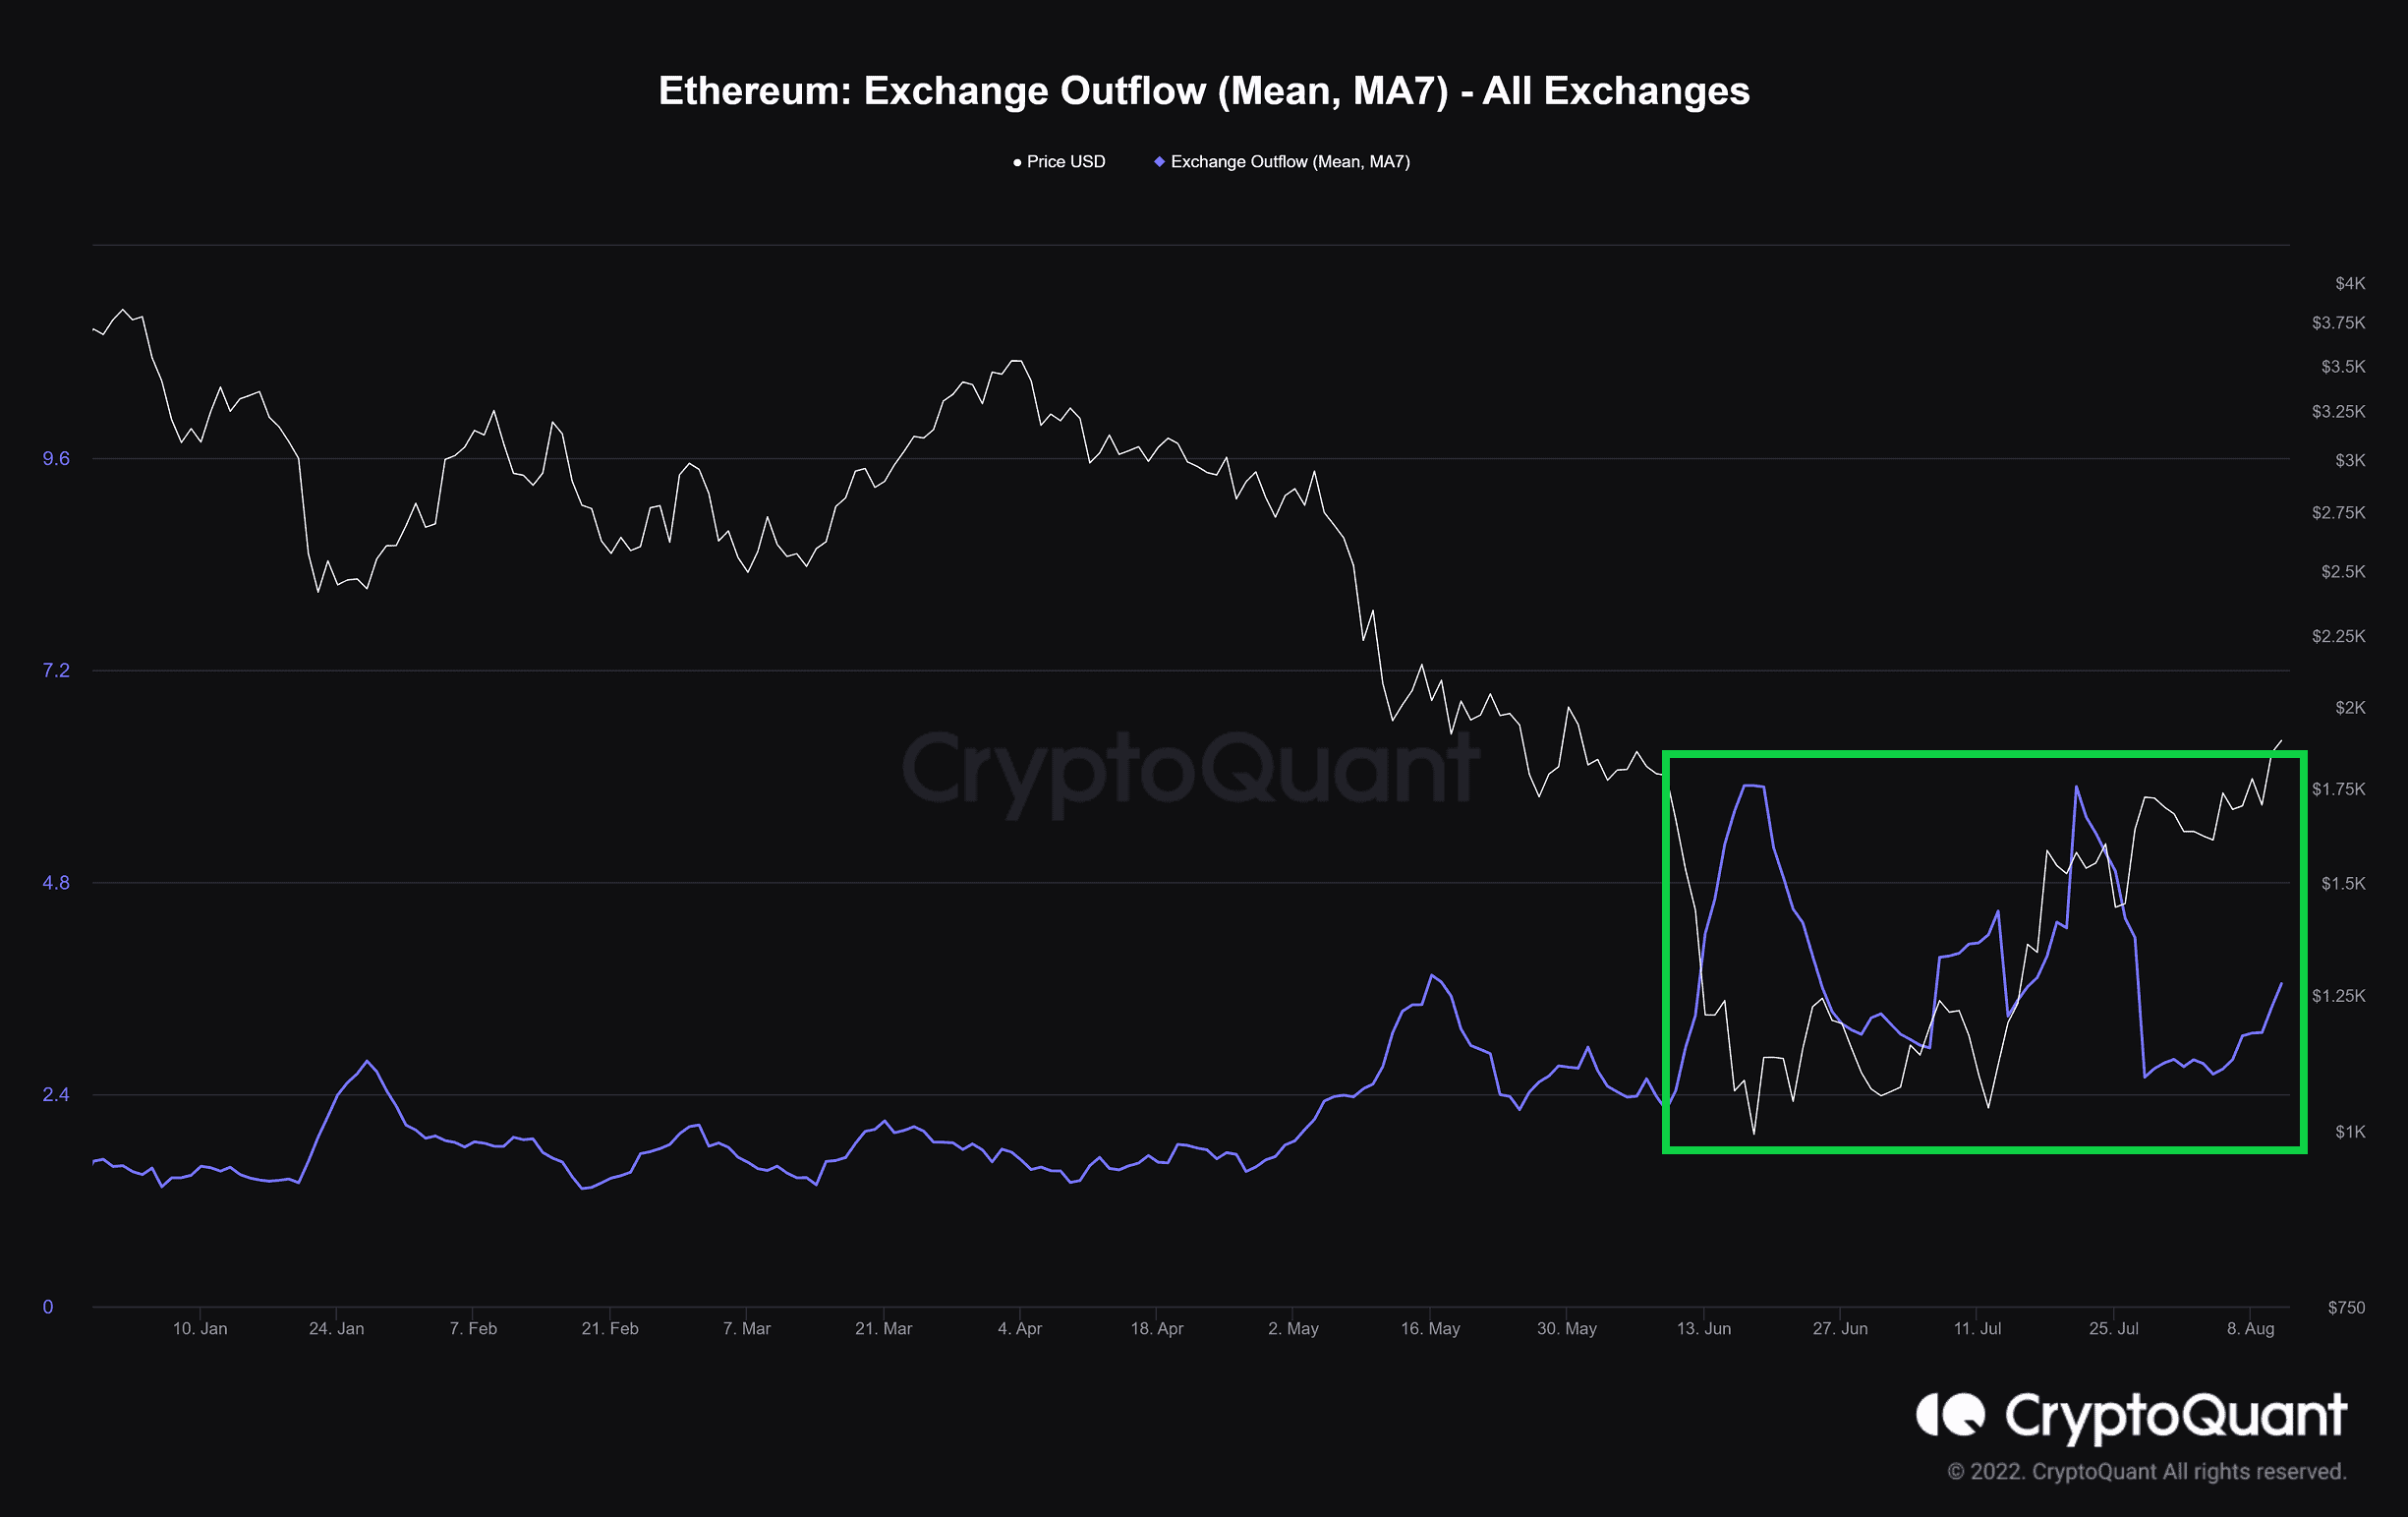
Definition: The seven days moving average of mean coins inflow/outflow to and from the exchange.
A high value indicates that investors who deposited or withdrew large amounts are increasing recently.
After Ethereum bottomed out at $880, the deposit of coins to the exchange decreased sharply. This could be due to positive news surrounding the Merge event. Meanwhile, the withdrawal of coins from the exchange did not reduce significantly. This indicates that buyers have dominated the exchanges. As long as this situation continues, the price is expected to touch higher levels.


The post ETH Eyes $2K on Further Merge Developments (Ethereum Price Analysis) appeared first on CryptoPotato.


