The bulls have been in control of the market for more than a month. They have managed to push the price by more than 100%. The majority of this rally has been without a considerable correction, begging the question if one is pending following the test of the critical $2K level.
Technical Analysis
By Grizzly
The Daily Chart
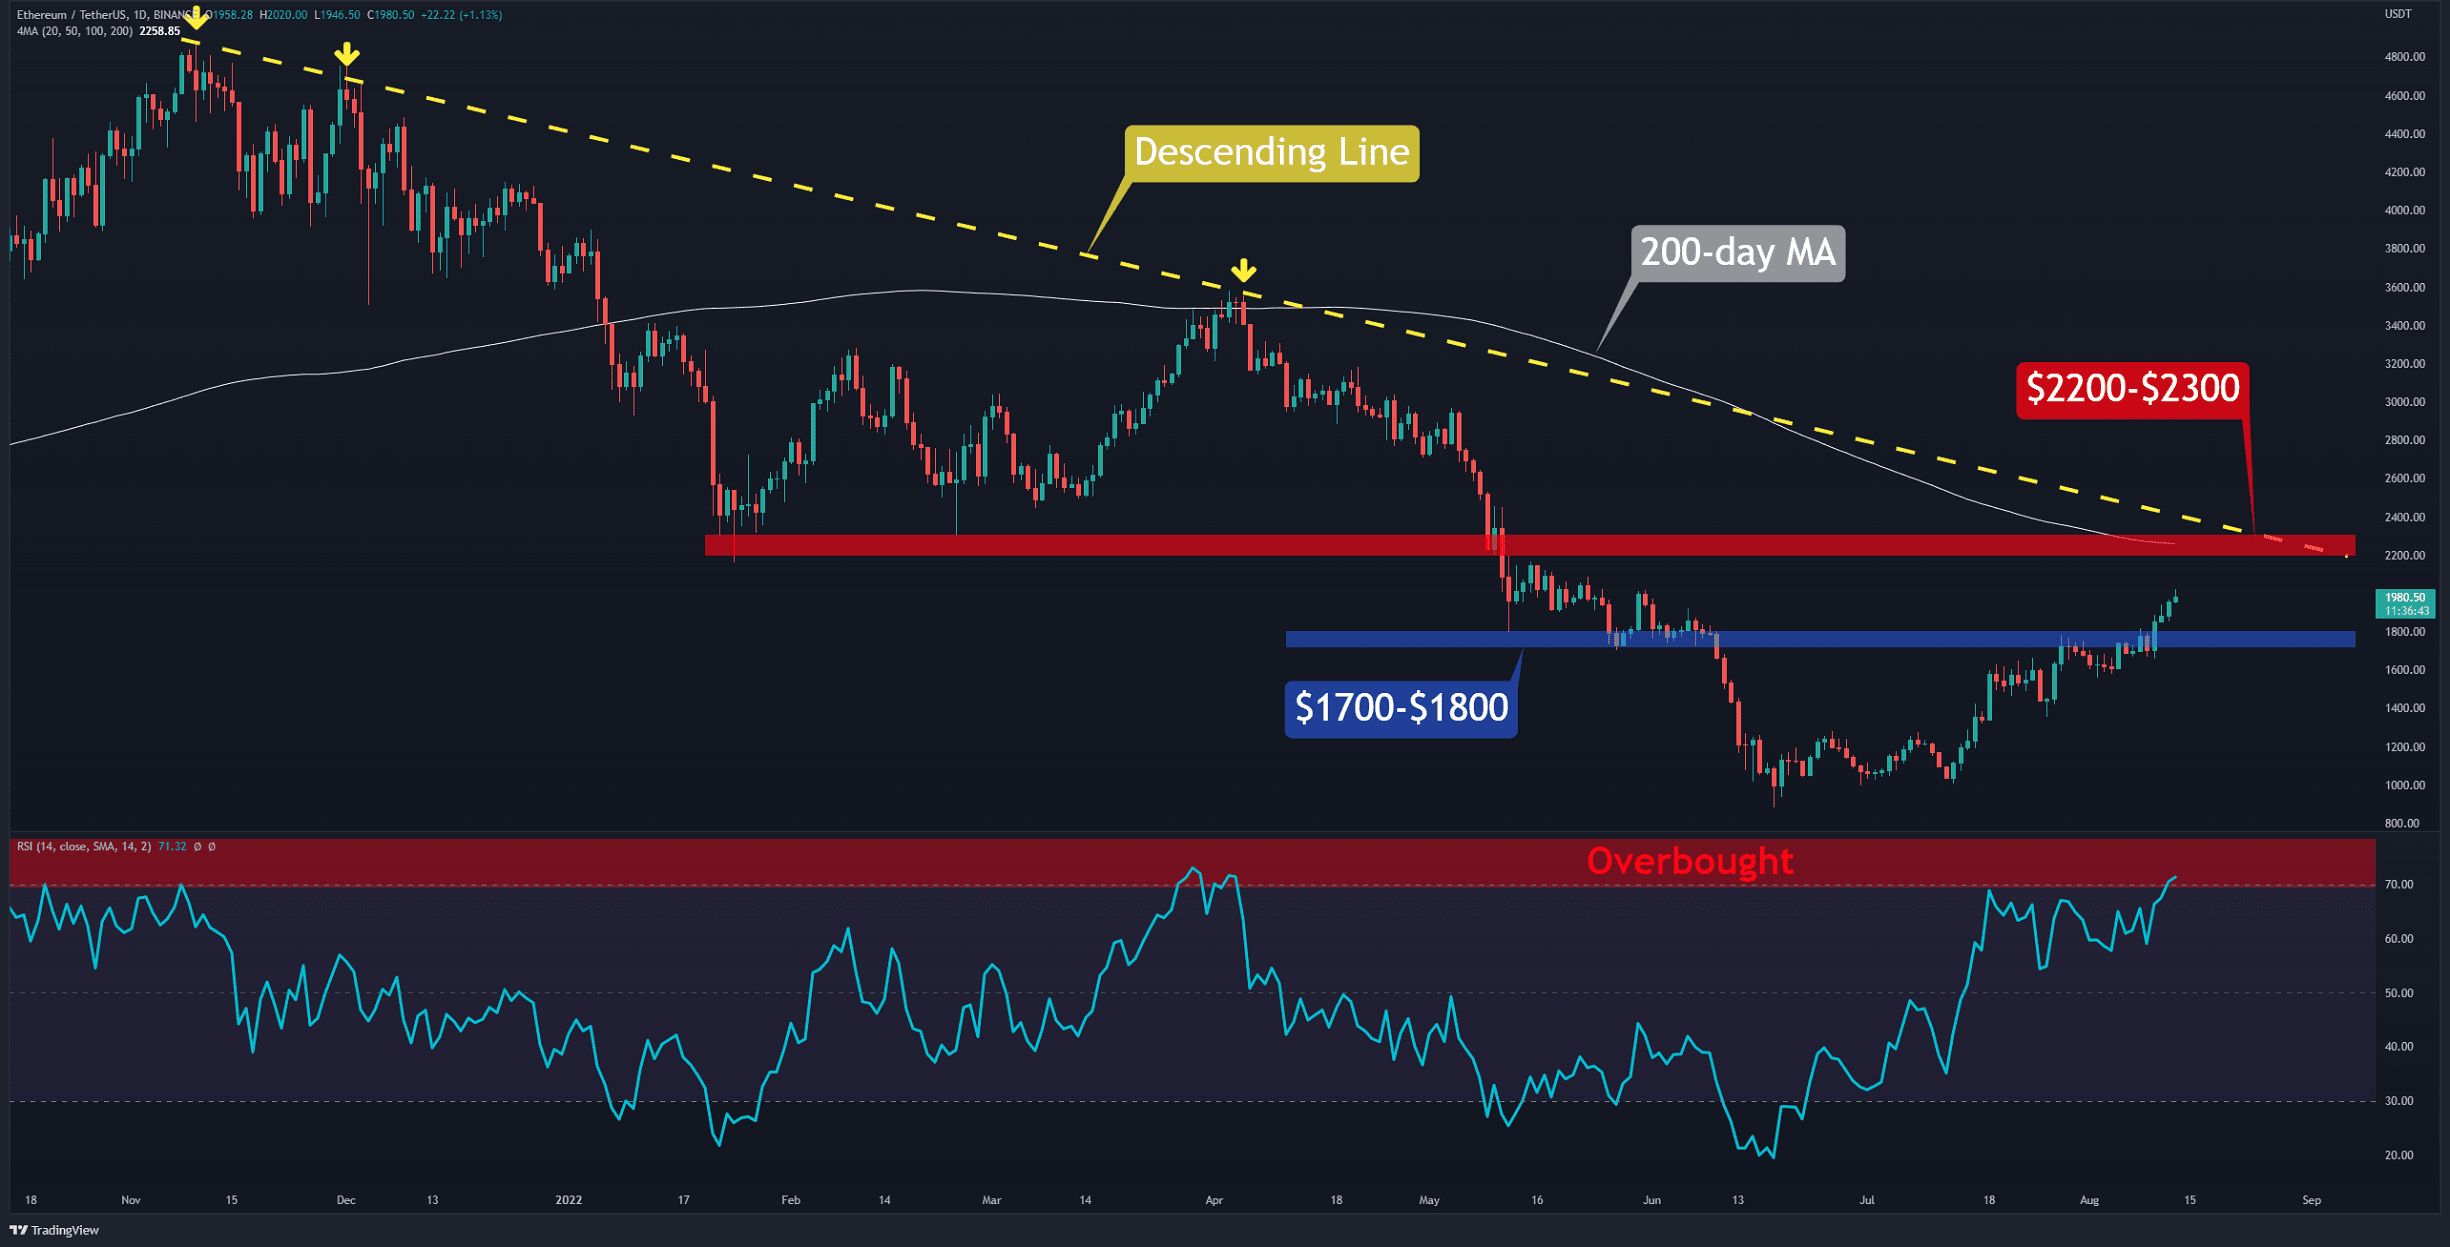
Buyers still dominate the market and push the price up. They were able to return to the $2,000 level after 74 days.
In the meantime, a critical resistance zone is blocking Ethereum. It is formed as a result of meeting the horizontal resistance in the $2200-2300 range (in red), the descending line resistance (in yellow), and the 200-day moving average (in white). A close above this zone can extend the rally to $2,700.
On the other hand, the Relative Strength Index (RSI) has reached above 70, which can be a warning sign. If Ethereum performs similarly to April 2022 and November 2021, it will likely take a break by touching/before touching the resistance zone. In this case, it can be expected that $1700-$1800 will be retested.
Key Support Levels: $1800 & $1500
Key Resistance Levels: $2160 & $2300
Daily Moving Averages:
MA20: $1705
MA50: $1436
MA100: $1600
MA200: $2258
The ETH/BTC Chart
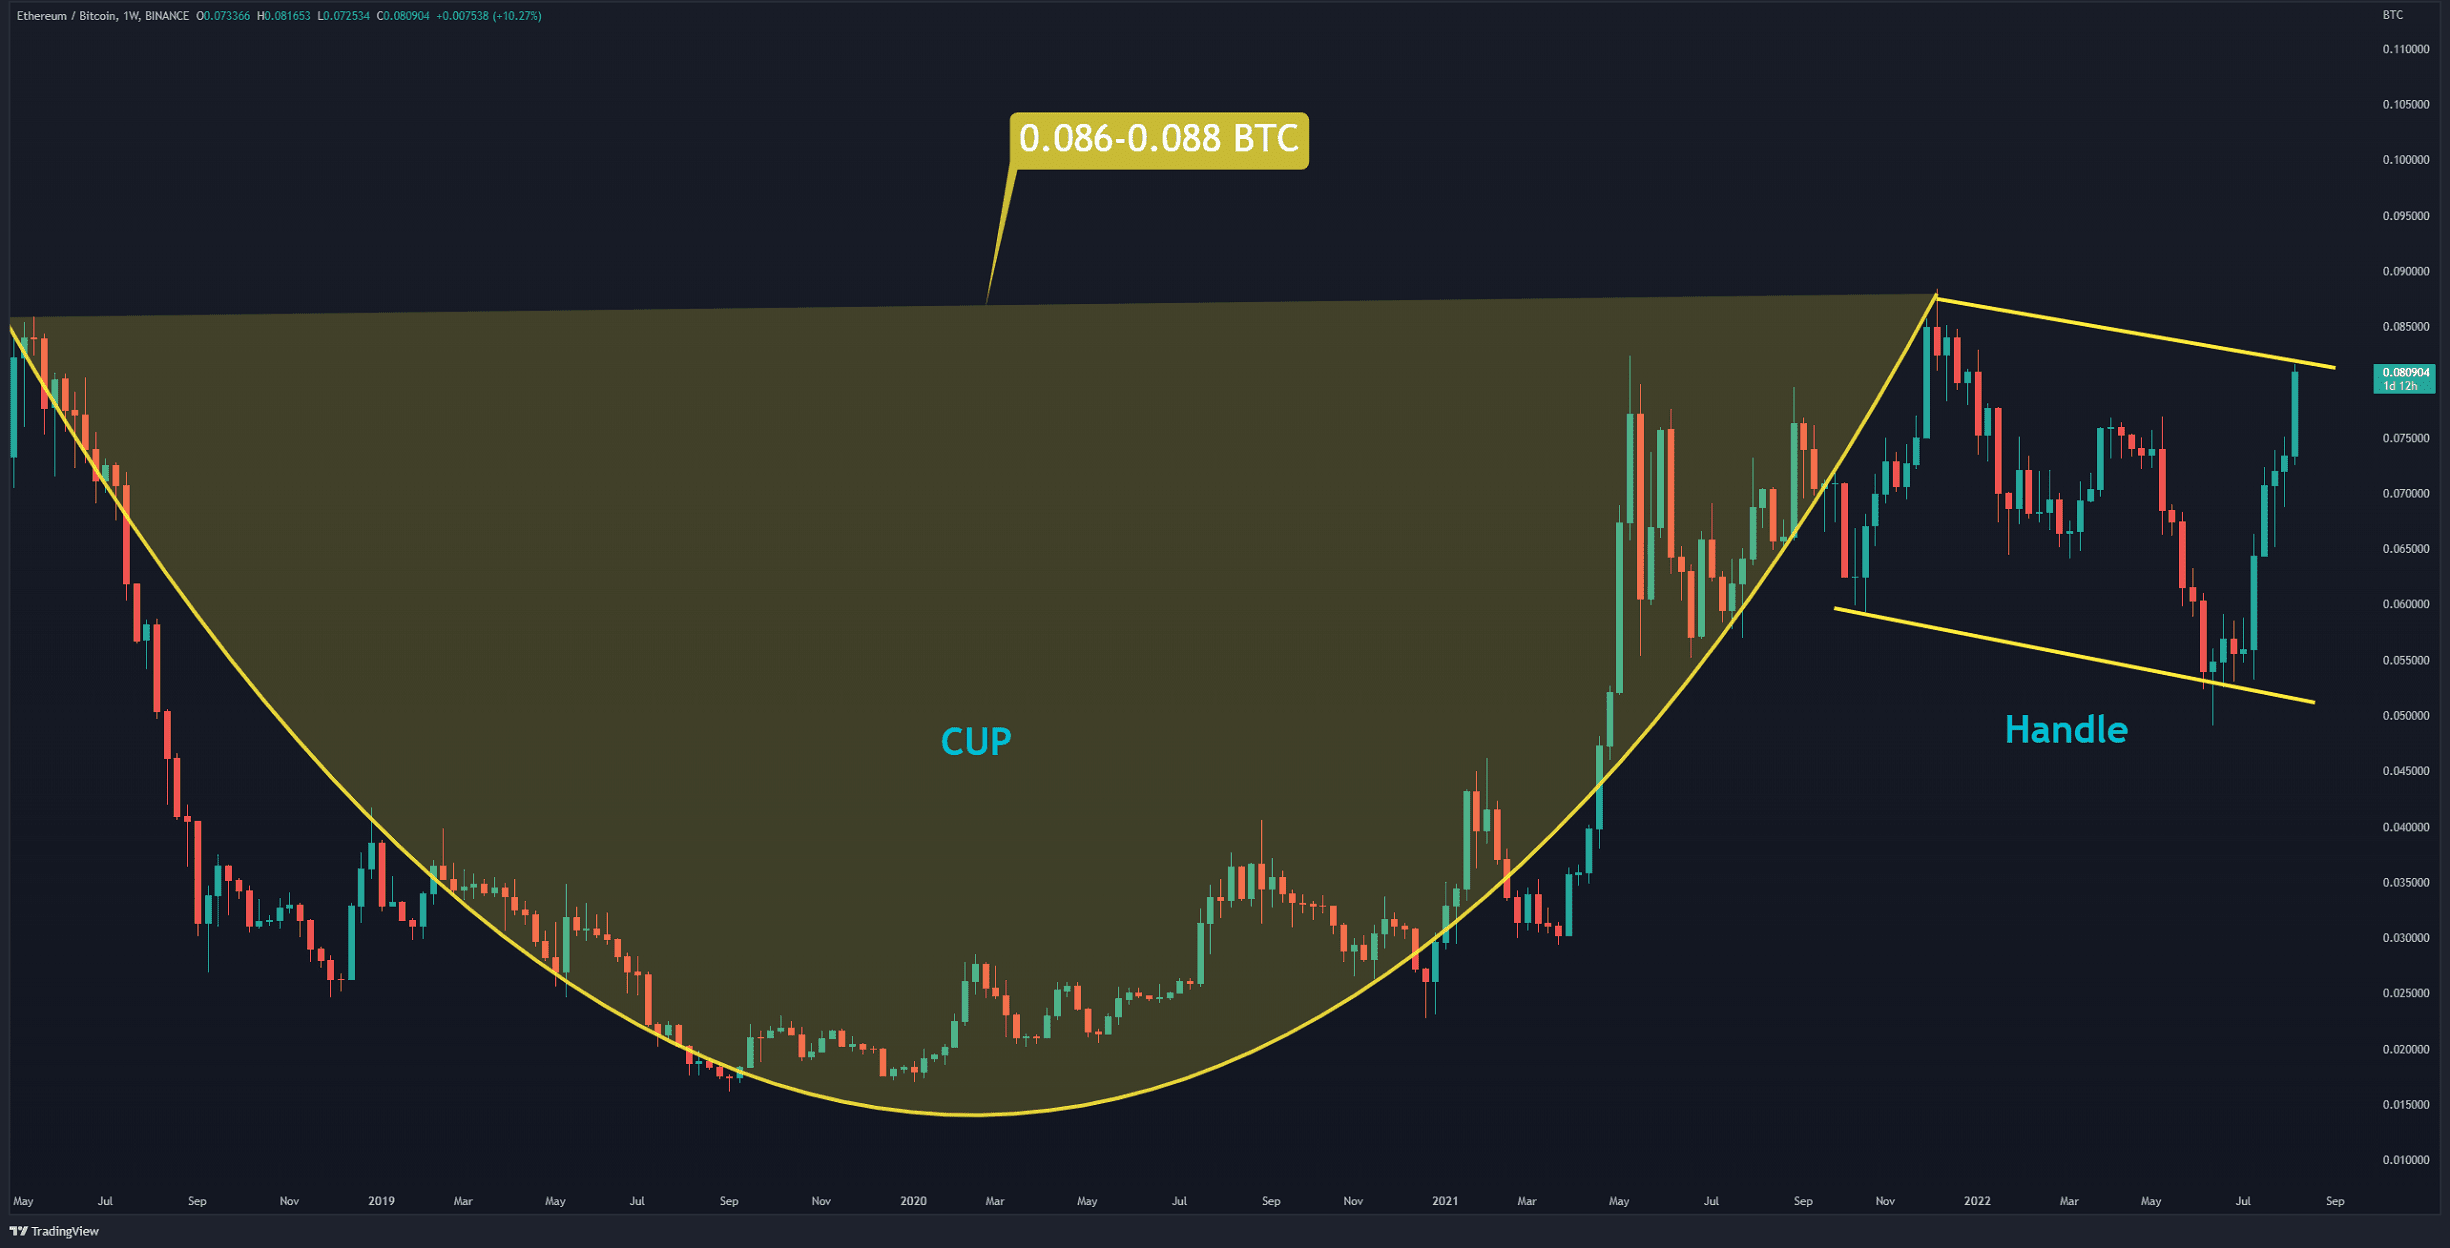
Against Bitcoin, the price is forming a cup and handle pattern (in yellow). The top of this pattern is in the range of 0.086 to 0.088 BTC. If the bulls can flip this level, it signals a bullish rally. Such a move can push ETH up to the target of 0.16 BTC. As long as the Ethereum fluctuates above 0.07 BTC, the bullish structure remains strong.
Key Support Levels: 0.0.75 & 0.07 BTC
Key Resistance Levels: 0.083 & 0.088 BTC
The post Ethereum Tests $2,000 For The First Time in 74 Days, Here’s What’s Next (ETH Price Analysis) appeared first on CryptoPotato.