
Bitcoin Analysis
Bitcoin’s price traded lower after a fierce rejection of the $25k level early on into Monday’s daily session. When traders settled up at the session close on Monday, BTC was -$206.
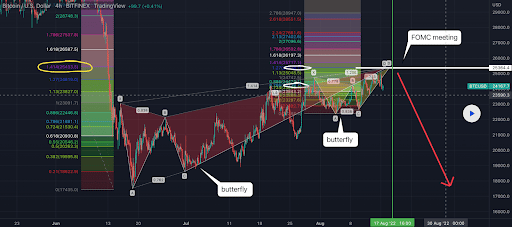
The first chart we’re analyzing for Tuesday is the BTC/USD 4HR chart below from LevRidge. BTC’s price is trading between the 0.618 fibonacci level [$23,843.2] and 0.786 [$24,238.7], at the time of writing.
Bullish traders suffered a strong rejection above the $25k level early into Monday’s new candle and now have targets back in the $24ks. The targets overhead for bullish market participants are 0.786, 0.886 [$24,474.1] and 1 [$24,742.5].
Conversely, bearish BTC traders have targets to the downside of the chart of 0.618, 0.5 [$23,565.4], and 0.382 [$23,287.6].
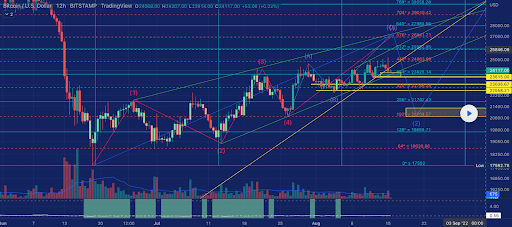
We can also see on the 12HR BTC chart below from mtrade8888 that BTC’s price could be trading diagonally in an Elliot Wave pattern setting up for the $27k level yet.
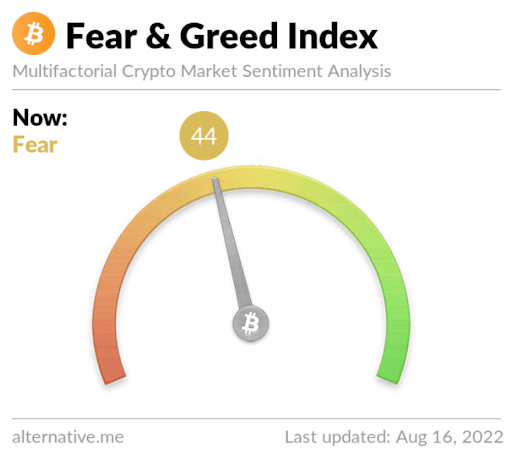
The Fear and Greed Index is 44 Fear and is -1 from Monday’s reading of 45 Fear.
Bitcoin’s Moving Averages: 5-Day [$23,922.21], 20-Day [$23,240.99], 50-Day [$22,466.18], 100-Day [$29,490.41], 200-Day [$37,785.11], Year to Date [$33,886.9].
BTC’s 24 hour price range is $23,758-$25,205 and its 7 day price range is $22,826.07-$24,205. Bitcoin’s 52 week price range is $17,611-$69,044.
The price of bitcoin on this date last year was $45,940.
The average price of BTC for the last 30 days is $23,003.9 and its +17.8% over the same time frame.
Bitcoin’s price [-0.85%] closed its daily candle worth $24,094 and in red figures for a second consecutive day on Monday.
Ethereum Analysis
Ether’s price underperformed BTC’s price on Monday and ETH was -$34.78 when traders wrapped up for ETH’s daily session.
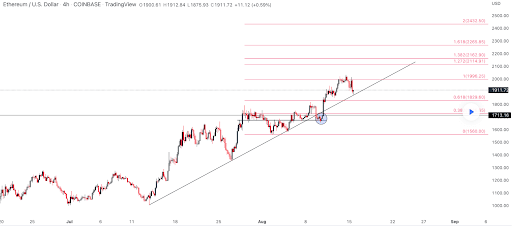
Today’s second chart for analysis is the ETH/USD 4HR chart below by DannyC914. Ether’s price is trading between 0.618 [$1,829.6] and 1 [$1,996.25], at the time of writing.
Those believing ETH’s price still has another level to markup yet before a potential pullback are eyeing the 1 fibonacci level as a primary target. The second target for bullish traders is 1.272 [$2,114.91], followed by 1.382 [$2,162.9] as a third target.
At variance with bullish traders are Ether bears that are looking to push ETH’s price back below the 0.618 firstly. If they succeed in that aim their next target is 0.382 [$1,726.65]. The third target to the downside for bearish traders is a full retracement back to 0 [$1,560.00].
Ether’s Moving Averages: 5-Day [$1,855.07], 20-Day [$1,672.62], 50-Day [$1,413.41], 100-Day [$2,009.17], 200-Day [$2,713.33], Year to Date [$2,353.18].
ETH’s 24 hour price range is $1,872.31-$2,012.47 and its 7 day price range is $1,671.64-$2,024.5. Ether’s 52 week price range is $883.62-$4,878.
The price of ETH on this date in 2021 was $3,146.57.
The average price of ETH for the last 30 days is $1,650.11 and its +60.72% over the same duration.
Ether’s price [-1.8%] closed its daily candle on Monday worth $1,900.25 and in red digits for a second day in a row.
Litecoin Analysis
Litecoin’s price also dropped on Monday and LTC concluded its daily session -$2.44.
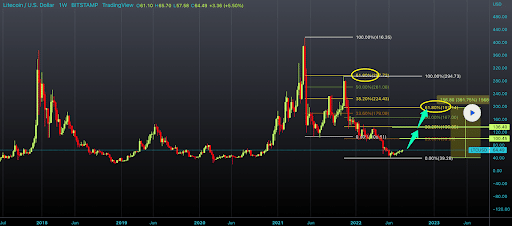
The last chart to round out our price analyses for Tuesday is the LTC/USD 1W chart below from Alex_master_forex. LTC’s price is trading between 0.00% [$39.26] and 23.60% [$99.55], at the time of writing.
Bullish LTC traders need to regain the 23.60% level to show market participants they can indeed generate a prolonged mid-term rally. The targets for Litecoin bulls are 23.60%, 38.20% [$136.05], and 50.00% [$167.00].
Bearish LTC market participants want to again retest a full retracement just below the $40 level and then attempt to send Litecoin’s price to a fresh 12-month low.
Litecoin’s Moving Averages: 5-Day [$61.51], 20-Day [$59.52], 50-Day [$55.23], 100-Day [$73.81], 200-Day [$110.17], Year to Date [$91.25].
LTC’s price is -65.72% against The U.S. Dollar for the last 12 months, -34.64% against BTC, and -43.42% against ETH, over the same time frame.
Litecoin’s 24 hour price range is $59.64-$65.32 and its 7 day price range is $58.37-$65.59. LTC’s 52 week price range is $40.4-$295.1.
Litecoin’s price on this date last year was $178.05.
The average price of LTC over the last 30 days is $59.13 and its +20.29% over the same timespan.
Litecoin’s price [-3.87%] closed its daily trading session on Monday worth $60.69 and in red figures for a second straight.
The post Bitcoin (24k), Ethereum (1.9k), Litecoin Price Analyses appeared first on The Cryptonomist.


