Bitcoin Analysis
Bitcoin’s price finished in red figures for a third consecutive day on Tuesday and concluded its daily trading session -$247.3.
The first chart we’re looking at for Wednesday is the BTC/USD 4HR chart below by YMGroup. BTC’s price is trading just below the $24k level, at the time of writing.
On the chart below we can see that BTC’s price may potentially be in an accumulation zone before making its next move. If this is an accumulation zone and BTC’s price does have another leg up yet, then the target of bullish BTC traders is the top of the current channel at $27k.
Bitcoin bulls have support at the $22k level if bearish traders continue to press lower.

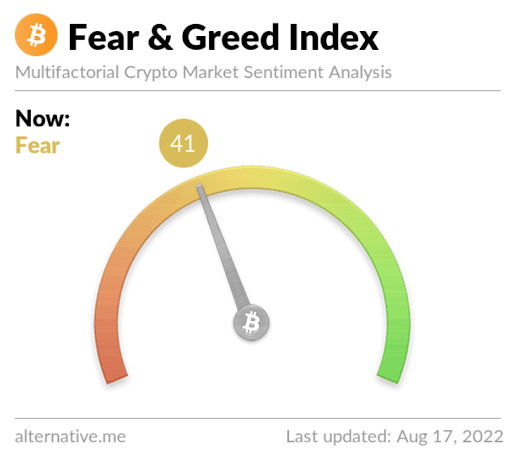
The Fear and Greed Index is 41 Fear and is -3 from Tuesday’s reading of 44 Fear.

Bitcoin’s Moving Averages: 5-Day [$24,049.44], 20-Day [$23,264.77], 50-Day [$22,314.61], 100-Day [$29,253.28], 200-Day [$37,565.3], Year to Date [$33,824.5].
BTC’s 24 hour price range is $23,671.2-$24,247.5 and its 7 day price range is $22,826.07-$24,995.08. Bitcoin’s 52 week price range is $17,611-$69,044.
The price of bitcoin on this date last year was $44,698.
The average price of BTC for the last 30 days is $23,090.3 and its +14% over the same duration.
Bitcoin’s price [-1.03%] closed its daily candle worth $23,855.6 on Tuesday.
Ethereum Analysis
Ether’s price also sold-off lower during Tuesday’s daily candle and when traders settled up at 12:00 UTC, ETH was -$23.57.
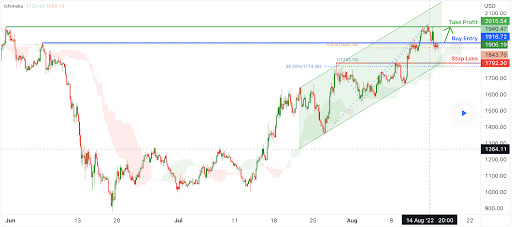
We’re also looking at Ether on the same time frame and the ETH/USD 4HR chart below by desmondlzw for Tuesday. Ether’s price is trading between the 1 fibonacci level [$1,793.16] and 0.618 [$1,885.38], at the time of writing.
The targets overhead on ETH for bullish traders are 0.618 and then back up to test the recent high of $2,024.5.
Bearish traders that are short the Ether market are looking to again push ETH’s price below the 1 fib level with a second target to the downside of the chart of 38.20% [$1,773.36]. The 38.20% fibonacci level is a pivotal level for short-term control of the Ethereum market. A break below that level will verify ETH’s current weakness – which will imply its stuck below the heartline of the current ascending channel on the 4HR time frame and testing the trend line.

Ether’s Moving Averages: 5-Day [$1,891.43], 20-Day [$1,688.52], 50-Day [$1,414.07], 100-Day [$1,993.99], 200-Day [$2,698.72], Year to Date [$2,350.24].
ETH’s 24 hour price range is $1,853-$1,915 and its 7 day price range is $1,671.64-$2,024.5. Ether’s 52 week price range is $883.62-$4,878.
The price of ETH on this date in 2021 was $3,012.34.
The average price of ETH for the last 30 days is $1,669.7 and its +52.30% for the same time frame.
Ether’s price [-1.24%] closed its daily candle on Tuesday worth $1,876.68 and in red figures for a third straight day.
Elrond Analysis
EGLD was the top performer of the project’s covered today but also traded lower at close than at its’ session open and EGLD finished Tuesday -$0.27.
The last chart we’re looking at for Wednesday is the EGLD/USD 1D chart below from MussadAbdulaziz. EGLD’s price is bumping up against overhead resistance at $65.28, at the time of writing.
That price level on EGLD is an important historical level with Elrond’s price holding above that level after breaking it initially for nearly all of 2021 and the first half of 2022.

EGLD’s price is -56.55% against The U.S. Dollar, -15.76% against BTC, and -25.47% against ETH, over the same duration.
Elrond’s Moving Averages: 5-Day [$64.10], 20-Day [$58.84], 50-Day [$56.41], 100-Day [$90.93], 200-Day [$N/A], Year to Date [$94.86].
EGLD’s 24 hour price range is $59.56-$61.96 and its 7 day price range is $59.56-$68.77. Elrond’s 52 week price range is $38.07-$542.7.
Elrond’s price on this date last year was $140.15.
The average price of EGLD over the last 30 days is $59.31 and its +2.23% over the same time frame.
Elrond’s price [-0.44%] closed its daily session on Tuesday worth $60.41 and in red figures for the fourth day in a row.
The post Bitcoin (23k), Ethereum (1.9k), Elrond Price Analyses appeared first on The Cryptonomist.


