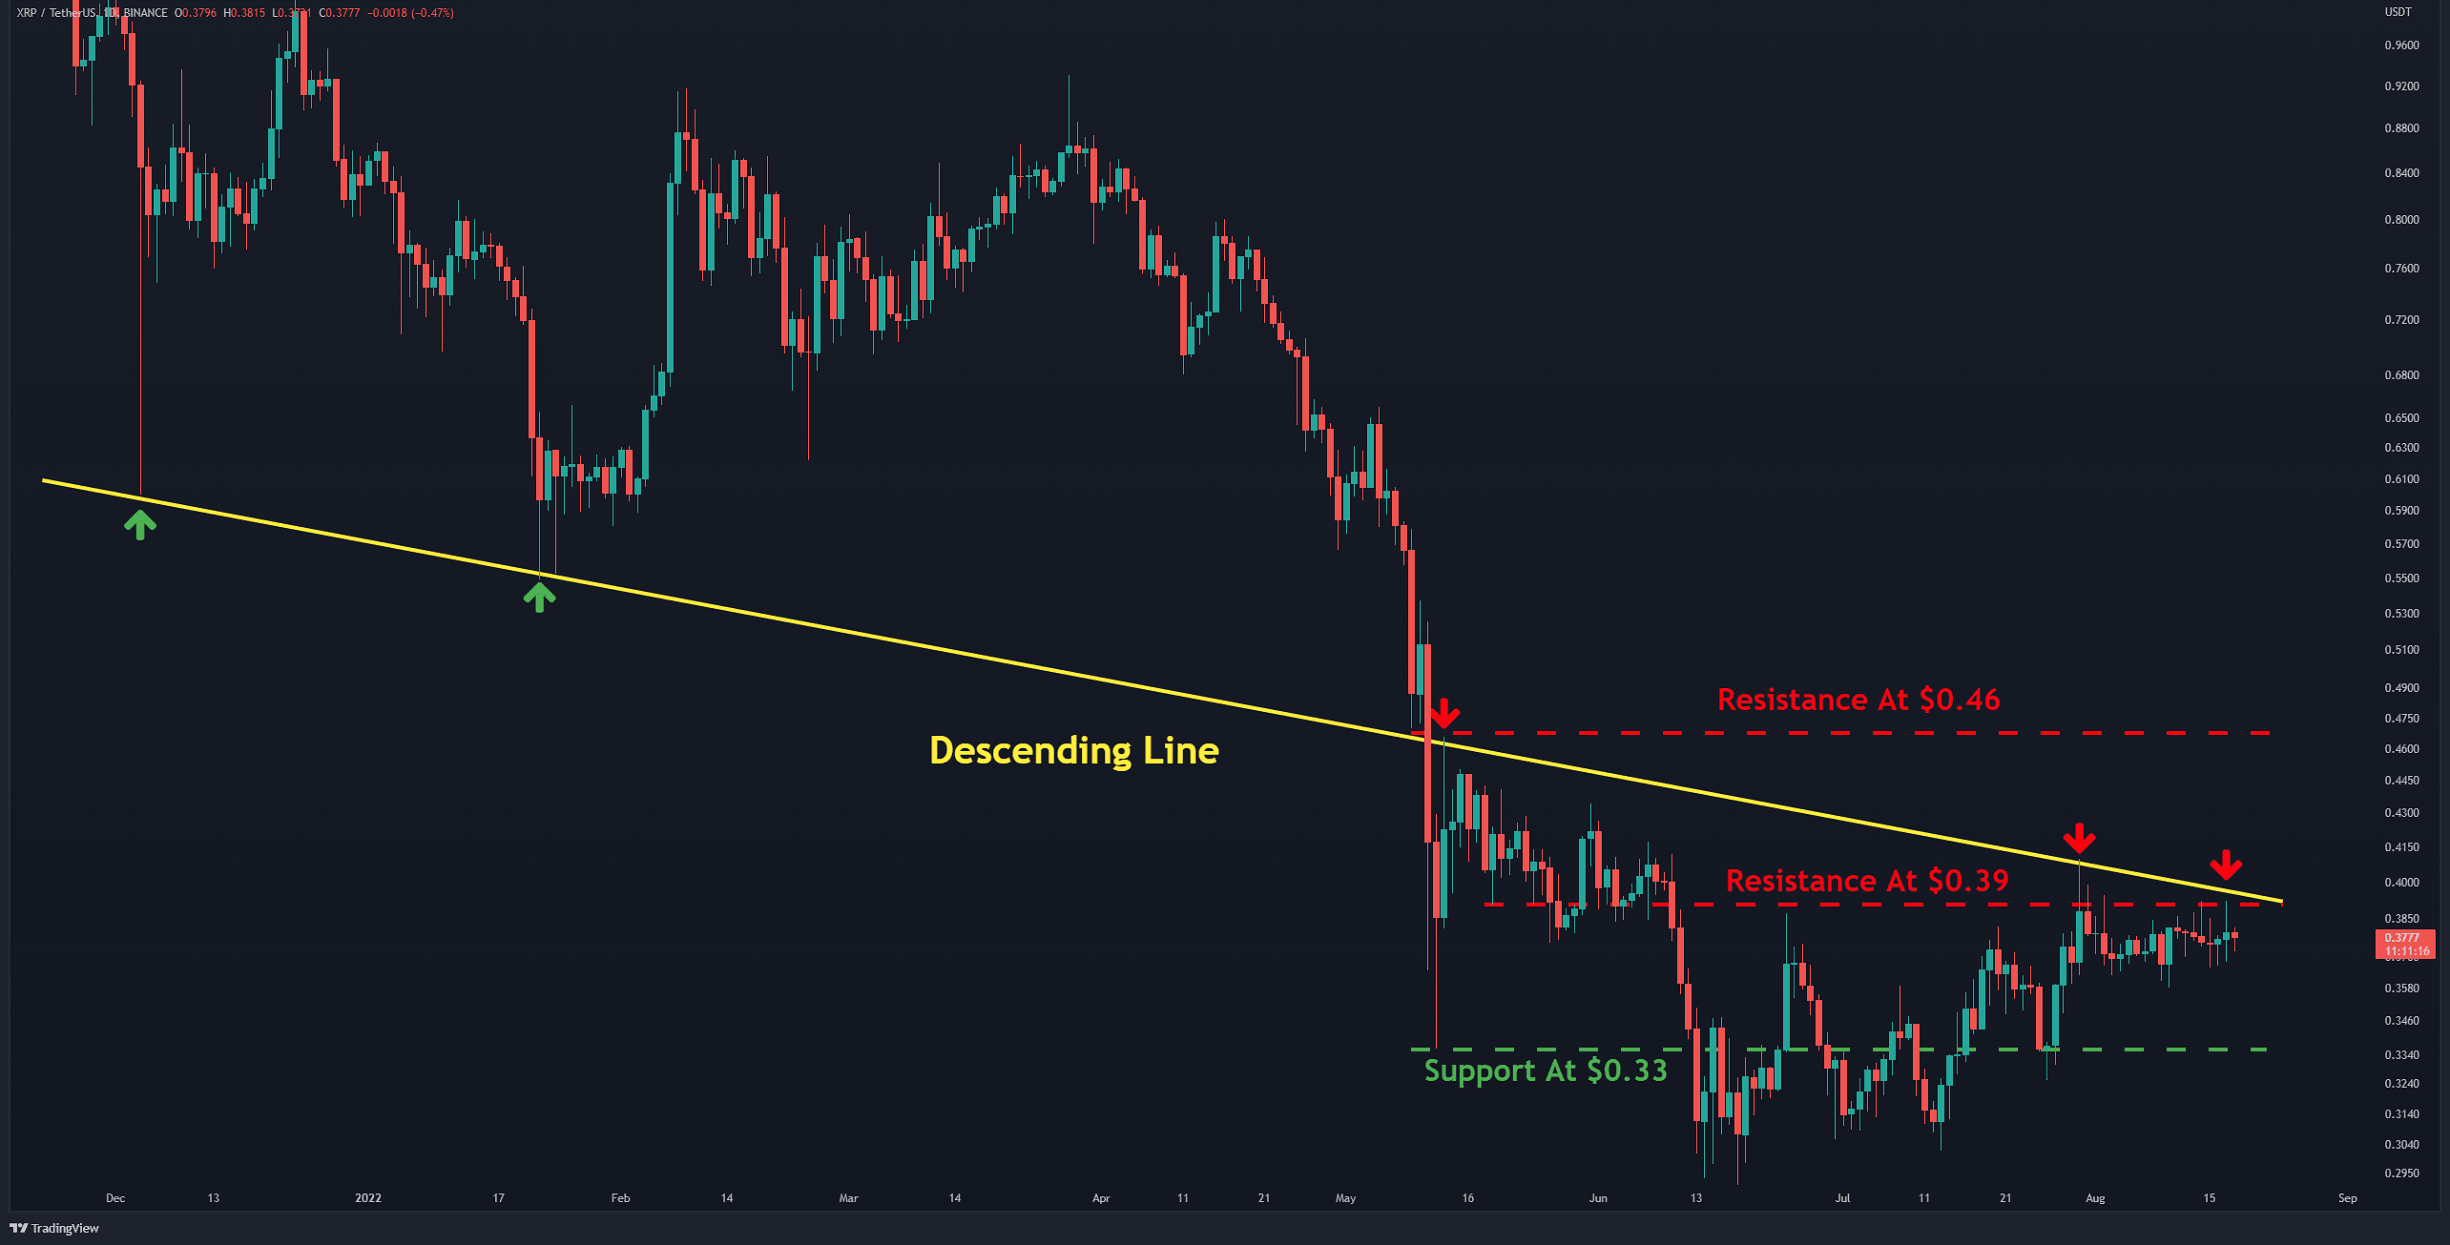
Ripple has been experiencing a sideways trend below the stiff resistance for nearly three weeks and has remained range-bound between 0.36$ and $0.39 for the largest part.
Technical Analysis
By Grizzly
The Weekly Chart:
It appears that neither side is able to take assert convincing dominance in the market for XRP. The bulls need to flip the horizontal resistance at $0.39 (in red) to start a rally. The intersection of this resistance with the descending line (in yellow) has created a relatively strong barrier.
Breaking this resistance could result in XRP charging at the subsequent target, which currently lies at $0.46. This would improve the overall structure and put bulls back on track. However, if the bears get the upper hand, the cryptocurrency could revisit the support at $0.33 (in green).

Key Support Levels: $0.33 & $0.28
Key Resistance Levels: $0.39 & $0.46
Daily Moving Averages:
MA20: $0.44
MA50: $0.71
MA100: $0.69
MA200: $0.48
The XRP/BTC Chart:
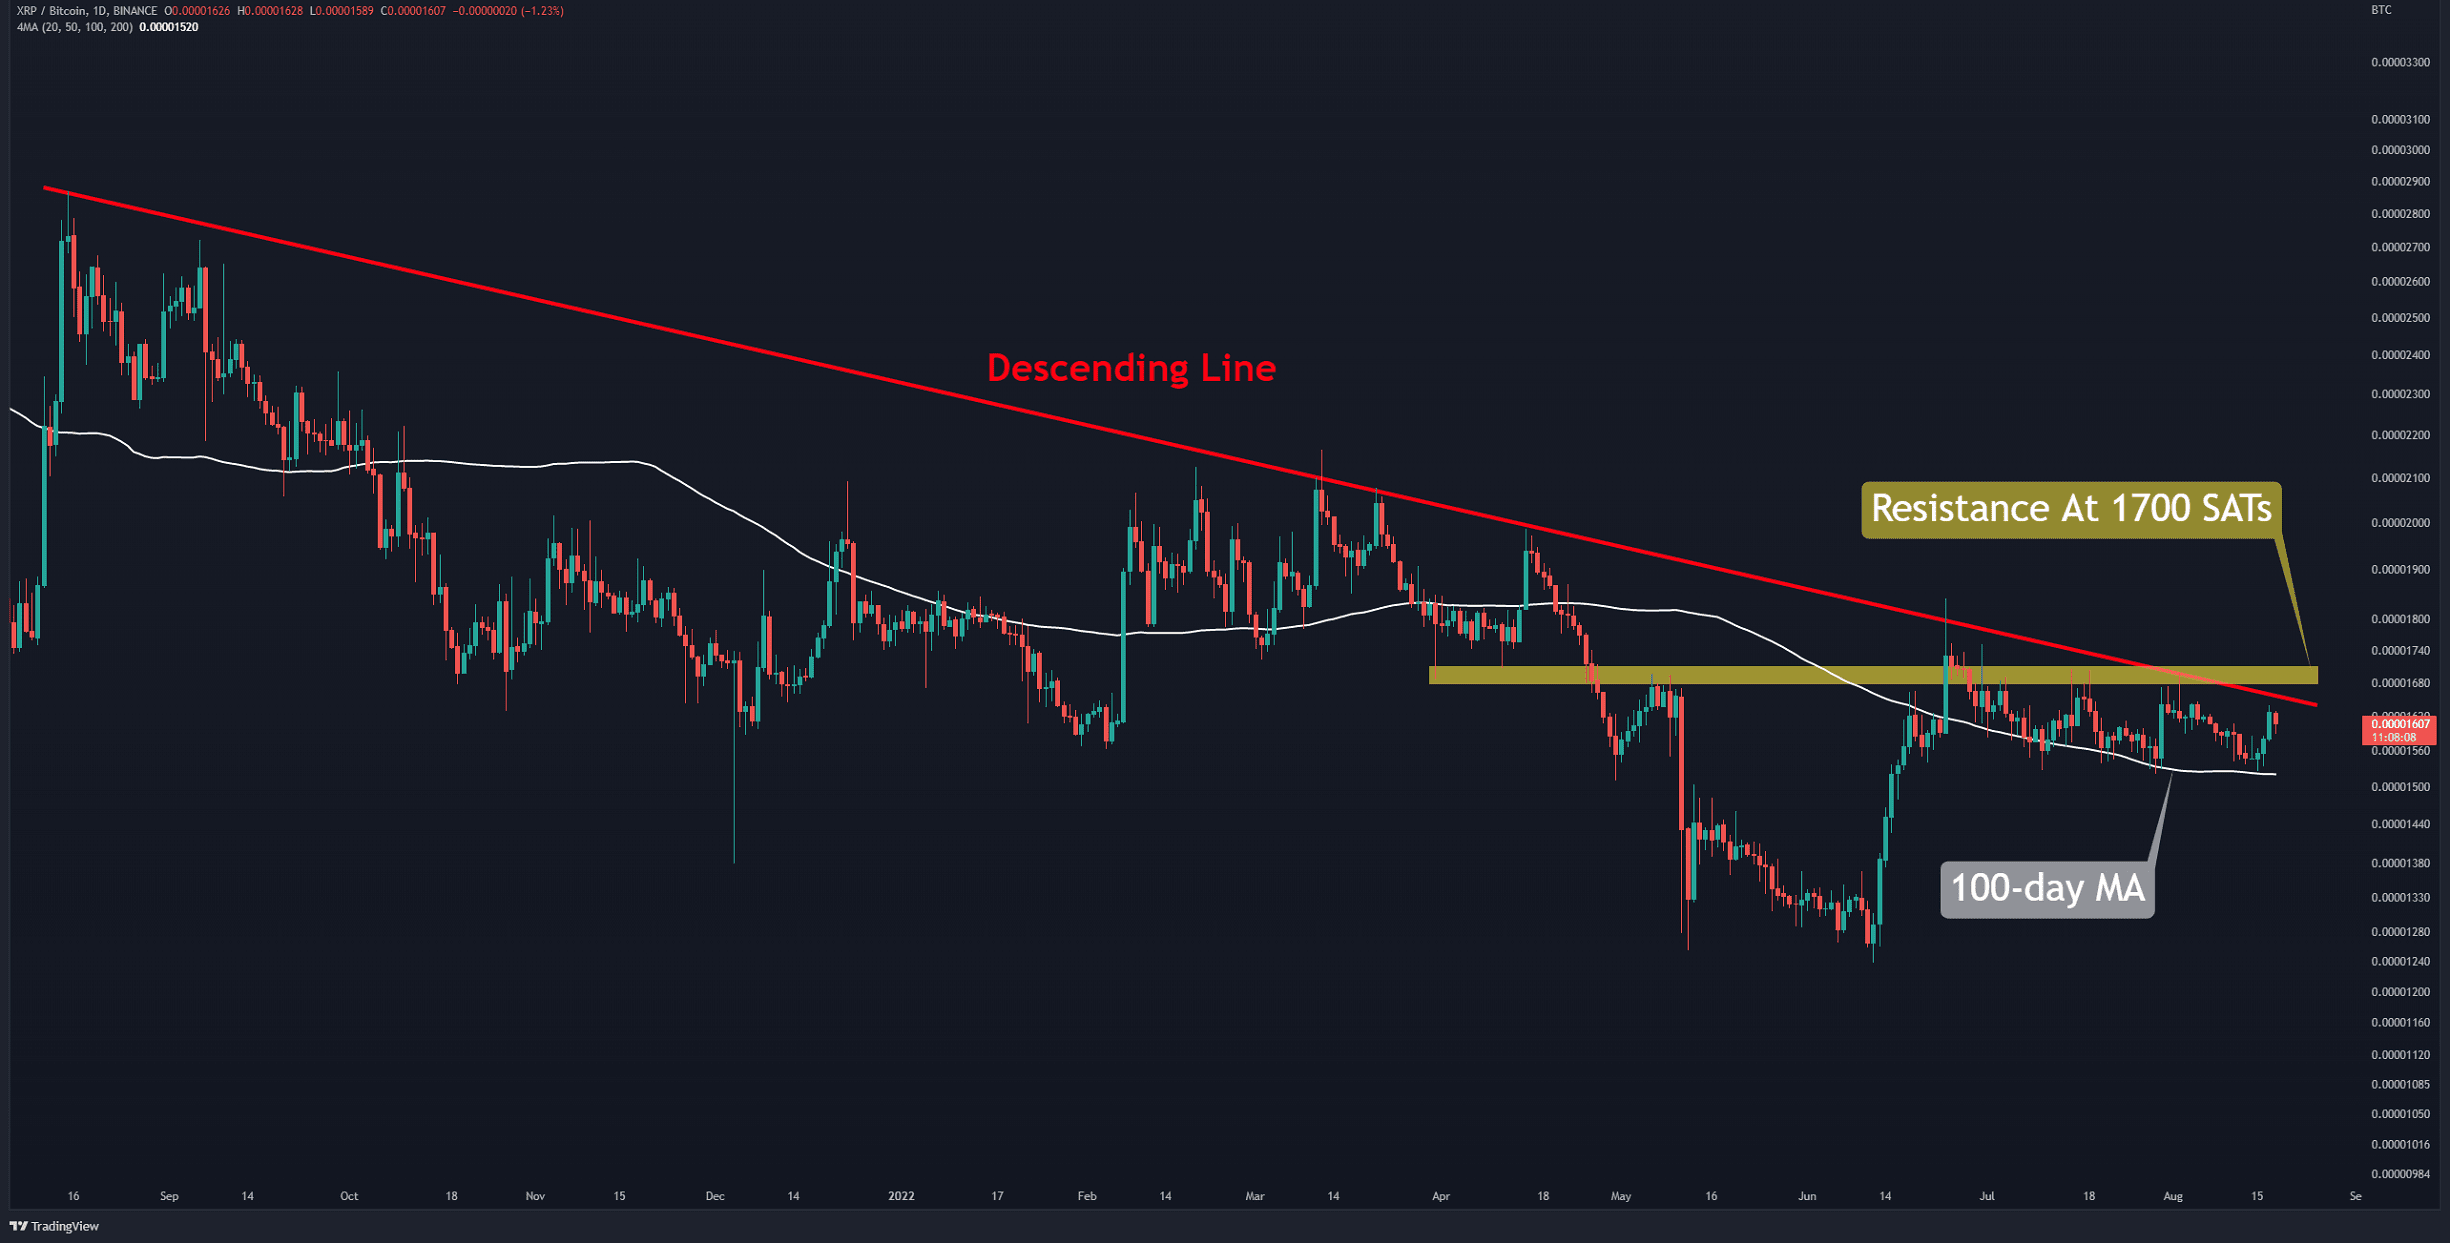
Against Bitcoin, the price is struggling with descending line resistance (in red) and horizontal resistance at 1700 SATs (in yellow). From the bottom side, the 100-day moving average (in white) acts as a support line. The structure is bearish in the short term as we can see both lower highs and lower lows taking place. A close below 1500 SATs will trigger a corrective wave. On the other hand, if the bulls push XRP above 1,700 SATs, it will probably extend to the next target at 2,000 SATs.
Key Support Levels: 1500 SATs & 1370 SATs
Key Resistance Levels: 1700 SATs & 2100 SATs

The post XRP Stalls at $0.37, But Is Another Crash Incoming? (Ripple Price Analysis) appeared first on CryptoPotato.


